

Question: 3. Plot the E, vs Ie characteristic curve for your DC shunt generator on the graph of Figure 7-4. Use the data from Table

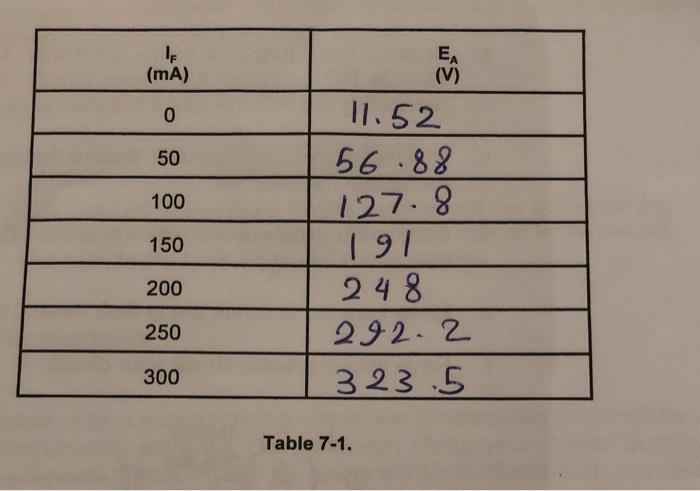
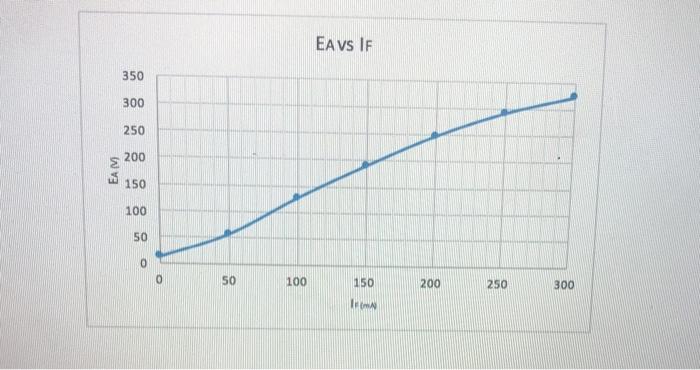
3. Plot the E, vs Ie characteristic curve for your DC shunt generator on the graph of Figure 7-4. Use the data from Table 7-1. Note that the curve "bends over" as the field current increases. Can you explain why this happens? EA (V) (mA) 11.52 56.88 127.8 191 248 50 100 150 200 250 292.2 323 5 300 Table 7-1. EA VS IF 350 300 250 S 200 150 100 50 50 100 150 200 250 300
Step by Step Solution
3.45 Rating (158 Votes )
There are 3 Steps involved in it
Answer Knowing that Eg k we can go on As a result the emf produced should be straightly proportional ... View full answer

Get step-by-step solutions from verified subject matter experts
Document Format (2 attachments)
635e007d01d64_180647.pdf
180 KBs PDF File
635e007d01d64_180647.docx
120 KBs Word File