

Question: Plot the following 2-D diagram using MATLAB/OCTAVE command line/m-file. Test image of Y (3 to 0 and 0 to 3) 3 2.5 2 1.5
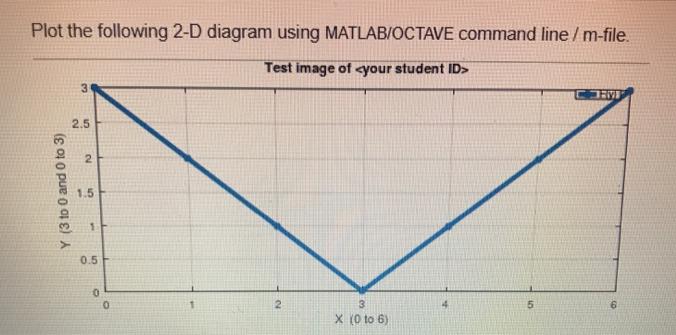
Plot the following 2-D diagram using MATLAB/OCTAVE command line/m-file. Test image of Y (3 to 0 and 0 to 3) 3 2.5 2 1.5 1 0.5 0 0 2 3 5 6 X (0 to 6)
Step by Step Solution
There are 3 Steps involved in it
1 Expert Approved Answer
Step: 1 Unlock

Question Has Been Solved by an Expert!
Get step-by-step solutions from verified subject matter experts
Step: 2 Unlock
Step: 3 Unlock