

Question: Plot the following data on both semilog graph paper and standard rectangular coordinates. Refer to this table for questions 1-5. What is the half-life t1/2
Plot the following data on both semilog graph paper and standard rectangular coordinates. Refer to this table for questions 1-5.
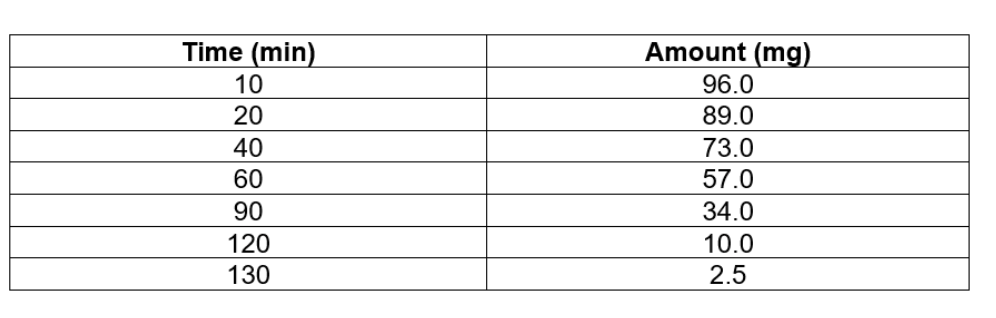
What is the half-life t1/2 in hours for the amount of drug to reduce from 100 to 50 mg?
Show all your work
Time (min) 10 20 40 60 90 120 130 Amount (mg) 96.0 89.0 73.0 57.0 34.0 10.0 2.5
Step by Step Solution
There are 3 Steps involved in it
1 Expert Approved Answer
Step: 1 Unlock

Question Has Been Solved by an Expert!
Get step-by-step solutions from verified subject matter experts
Step: 2 Unlock
Step: 3 Unlock