

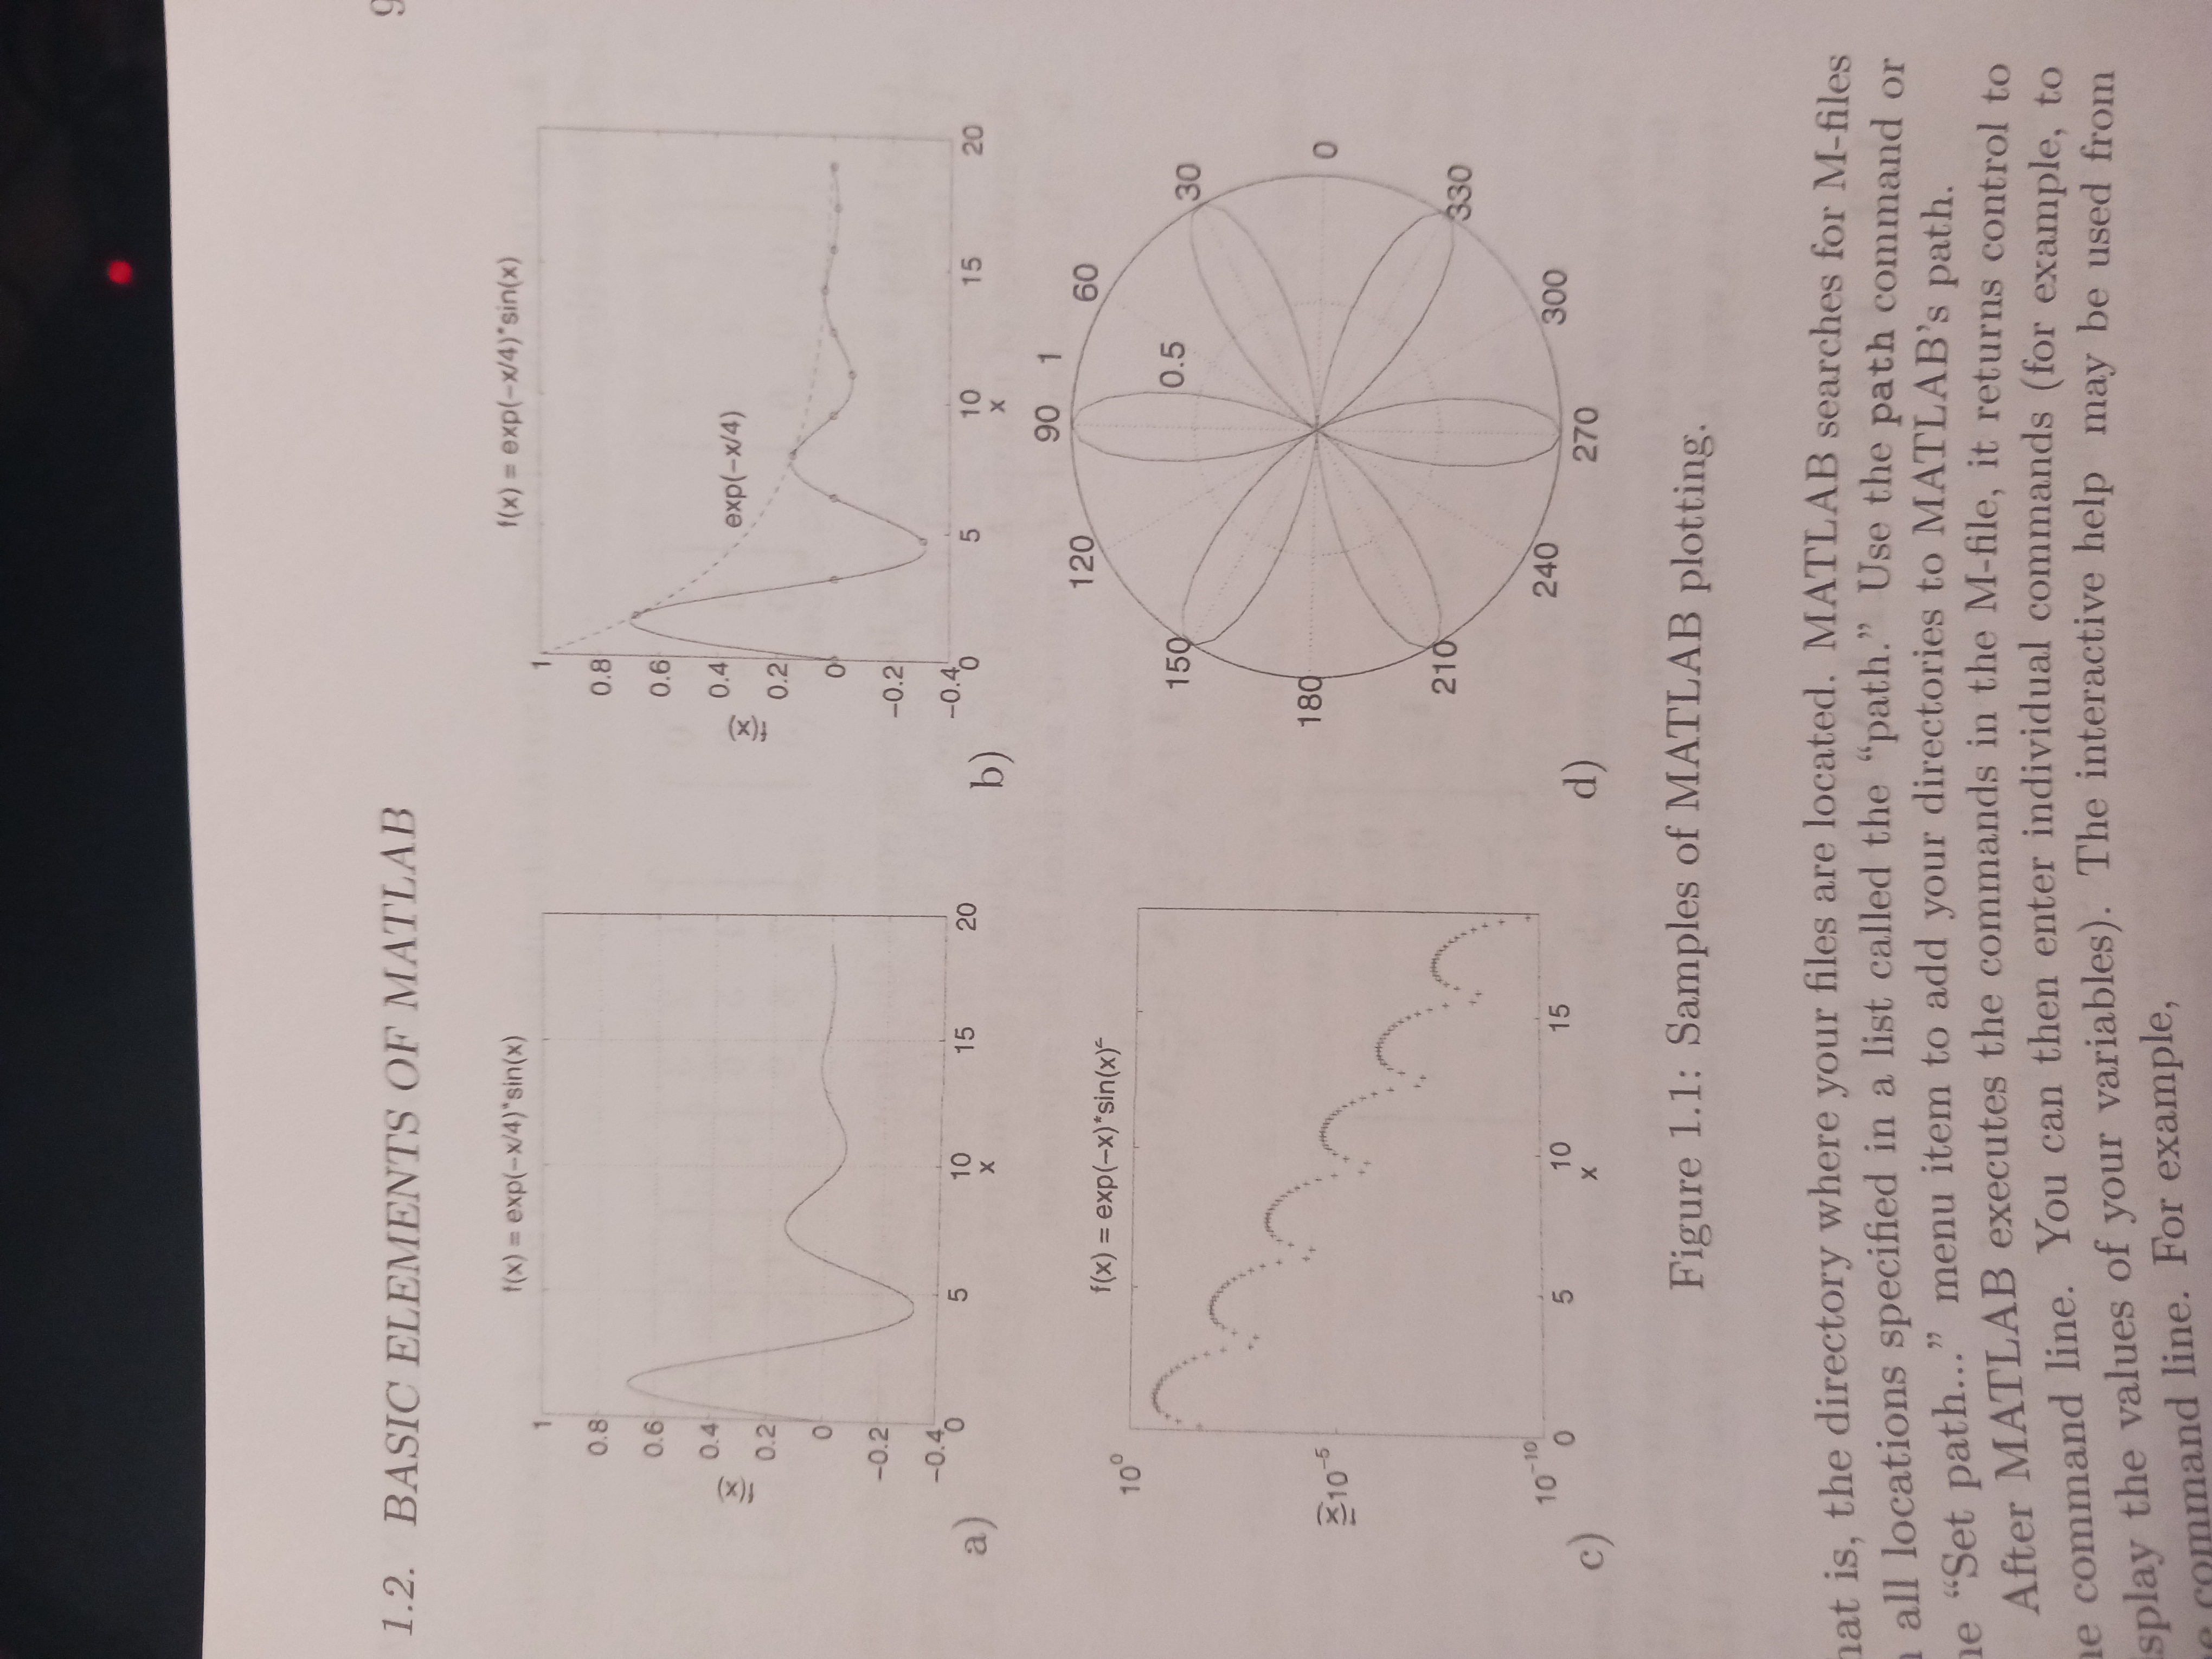
Question: Plot the following functions as shown in figure 1 . 1 in the book. Match the figures as closely as you can. ( a )
Plot the following functions as shown in figure in the book. Match the figures as
closely as you can. ab but show the function
as a dotted line in addition to c d a polar graph with
with six "flower petals" BASIC ELEMENTS OF MATLAB
a
b
d
Figure : Samples of MATLAB plotting.
nat is the directory where your files are located. MATLAB searches for Mfiles
all locations specified in a list called the "path." Use the path command or
le "Set path..." menu item to add your directories to MATLAB's path.
After MATLAB executes the commands in the Mfile, it returns control to
command line. You can then enter individual commands for example, to
splay the values of your variables The interactive help may be used from
command line. For example,
Step by Step Solution
There are 3 Steps involved in it
1 Expert Approved Answer
Step: 1 Unlock

Question Has Been Solved by an Expert!
Get step-by-step solutions from verified subject matter experts
Step: 2 Unlock
Step: 3 Unlock