

Question: Plot the folowing data using the appropriate plot types making sure to adding lables, units, and titles. Also refer to the matplotlib gallery to figure
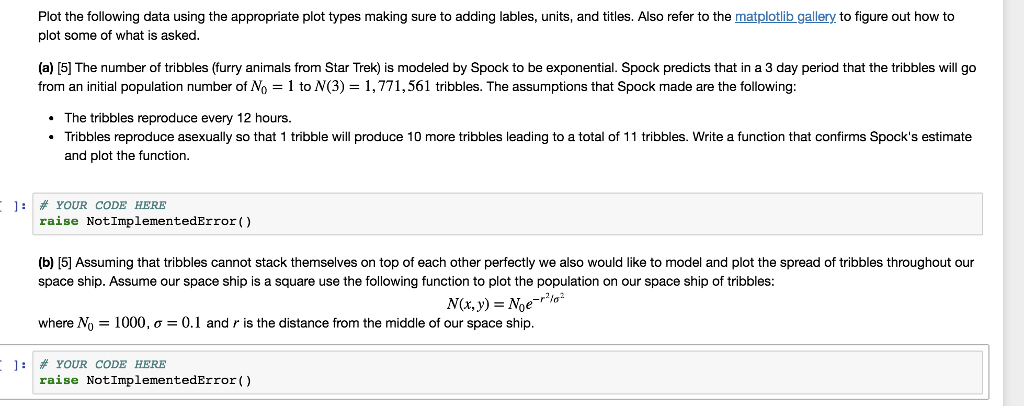
Plot the folowing data using the appropriate plot types making sure to adding lables, units, and titles. Also refer to the matplotlib gallery to figure out how to plot some of what is asked (a 5 The number of tribbles furry animals from Star Trek is modeled by Spock to be exponential Spock edicts that na 3 da pe from an initial population number of No = l to N(3) = 1,771,561 tribbles. The assumptions that Spock made are the following: o e r ble il The tribbles reproduce every 12 hours. Tribbles reproduce asexually so that 1 tribble will produce 10 more tribbles leading to a total of 11 tribbles. Write a function that confirms Spock's estimate and plot the function. : # YOUR CODE HERE raise NotImplementedError) (b) [5] Assuming that tribbles cannot stack themselves on top of each other perfectly we also would like to model and plot the spread of tribbles throughout our space ship. Assume our space ship is a square use the following function to plot the population on our space ship of tribbles where No-1000, -0. 1 and r is the distance from the middle of Our space ship. ]: # YOUR CODE HERE raise NotImplementedError) Plot the folowing data using the appropriate plot types making sure to adding lables, units, and titles. Also refer to the matplotlib gallery to figure out how to plot some of what is asked (a 5 The number of tribbles furry animals from Star Trek is modeled by Spock to be exponential Spock edicts that na 3 da pe from an initial population number of No = l to N(3) = 1,771,561 tribbles. The assumptions that Spock made are the following: o e r ble il The tribbles reproduce every 12 hours. Tribbles reproduce asexually so that 1 tribble will produce 10 more tribbles leading to a total of 11 tribbles. Write a function that confirms Spock's estimate and plot the function. : # YOUR CODE HERE raise NotImplementedError) (b) [5] Assuming that tribbles cannot stack themselves on top of each other perfectly we also would like to model and plot the spread of tribbles throughout our space ship. Assume our space ship is a square use the following function to plot the population on our space ship of tribbles where No-1000, -0. 1 and r is the distance from the middle of Our space ship. ]: # YOUR CODE HERE raise NotImplementedError)
Step by Step Solution
There are 3 Steps involved in it

Get step-by-step solutions from verified subject matter experts