

Question: Plot the function as 3D graphics in Python. Research how you can increase the legibility of such an illustration by using different colors for different
Plot the function 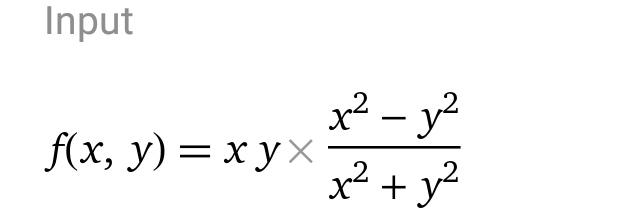 as 3D graphics in Python. Research how you can increase the legibility of such an illustration by using different colors for different z-values and try this out.
Input x - y f(x, y) = xyx x + y
Step by Step Solution
There are 3 Steps involved in it
1 Expert Approved Answer
Step: 1 Unlock

Question Has Been Solved by an Expert!
Get step-by-step solutions from verified subject matter experts
Step: 2 Unlock
Step: 3 Unlock