

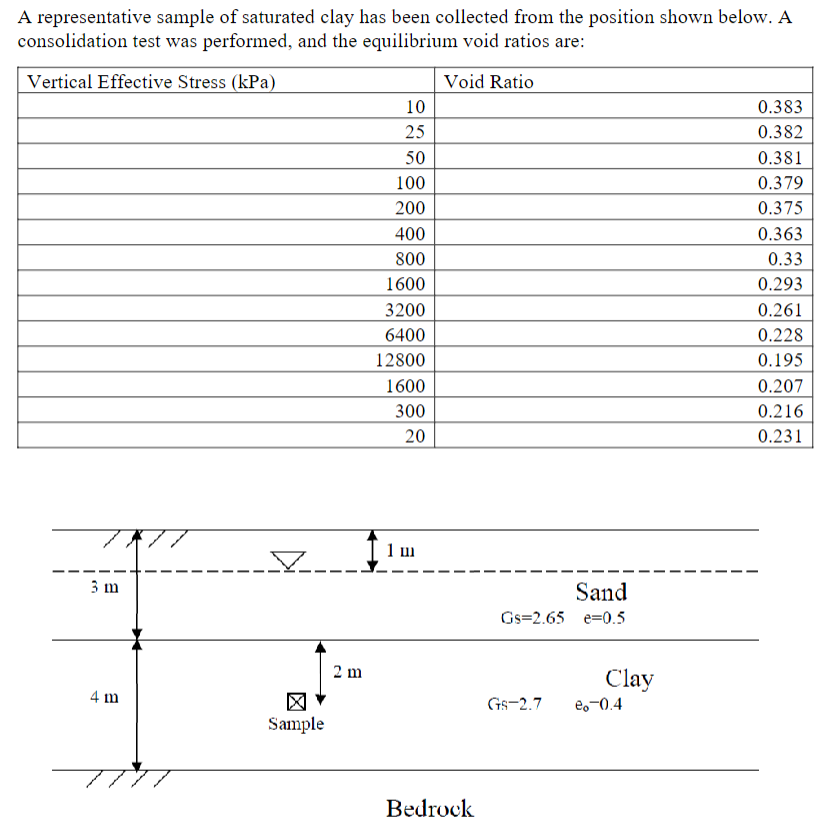
Question: Plot the laboratory effective vertical stress vs . void ratio curve on both arithmetic and semilogarithmic graphs. Note: Don t connect the points with straight
Plot the laboratory effective vertical stress vs void ratio curve on both arithmetic and
semilogarithmic graphs. Note: Dont connect the points with straight lines. Instead, draw a
smooth curve through the points this will make step easier Plots should be drawn using a
software eg Excel Points will be deducted for handdrawn plots.
b Determine the preconsolidation stress for the sample. Present your approach graphically on
your plot.
c Determine the present vertical effective stress at the location of the sample.
CIVILEN
HW
d What is the OCR of the sample? Is the clay normally consolidated or overconsolidated?
e Construct the field compression curve. Note: eo Present your approach graphically on
your plot.
f Calculate Cc and Cs Note: Cc from the constructed field curve, Cs from lab unloading curve.
g A wide highway embankment unit weight kNm is to be constructed on the site.
Estimate the total consolidation settlement if the height of the embankment is am b
m For both cases, solve the problem using appropriate settlement equation with Cc and Cs
Assume the sand is incompressible.
h If onsite clay has a Cv value of myr estimate the time required for of settlement to
occur. The bedrock is highly fractured and, hence, can be considered as a drainage boundary.
Step by Step Solution
There are 3 Steps involved in it
1 Expert Approved Answer
Step: 1 Unlock

Question Has Been Solved by an Expert!
Get step-by-step solutions from verified subject matter experts
Step: 2 Unlock
Step: 3 Unlock