

Question: Plot the points on the graph of f(x) = (x+6)-5 that correspond to x-values of -8 and -10. Then plot the vertex and the
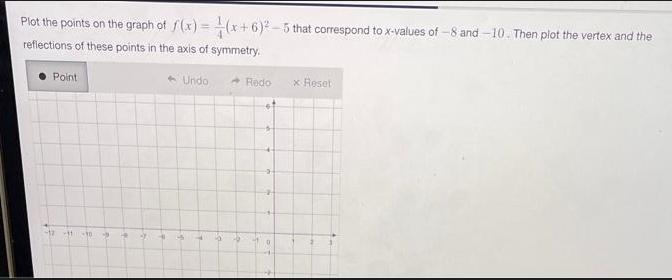
Plot the points on the graph of f(x) = (x+6)-5 that correspond to x-values of -8 and -10. Then plot the vertex and the reflections of these points in the axis of symmetry. Point -12 H -10 4 4 27 4 Undo 10 -9 Redo x Reset
Step by Step Solution
★★★★★
3.37 Rating (153 Votes )
There are 3 Steps involved in it
1 Expert Approved Answer
Step: 1 Unlock

Question Has Been Solved by an Expert!
Get step-by-step solutions from verified subject matter experts
Step: 2 Unlock
Step: 3 Unlock