

Question: Plot the respective growth rates & show the plotting commands and the output graphs for the following problem: Take the following list of functions and
Plot the respective growth rates & show the plotting commands and the output graphs for the following problem:
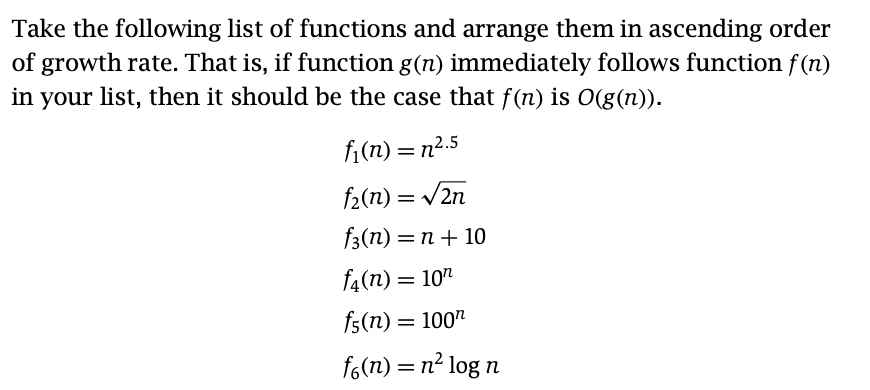
Take the following list of functions and arrange them in ascending order of growth rate. That is, if function g(n) immediately follows function f(n) in your list, then it should be the case that f(n) is O(g(n)). f1(n)=n2.5f2(n)=2nf3(n)=n+10f4(n)=10nf5(n)=100nf6(n)=n2logn
Step by Step Solution
There are 3 Steps involved in it
1 Expert Approved Answer
Step: 1 Unlock

Question Has Been Solved by an Expert!
Get step-by-step solutions from verified subject matter experts
Step: 2 Unlock
Step: 3 Unlock