

Question: Plot the scatterplot matrix of six variables Produce summaries of the variable m400, including 0 Numerical summaries: average, standard deviation, median and quartiles, maximum and
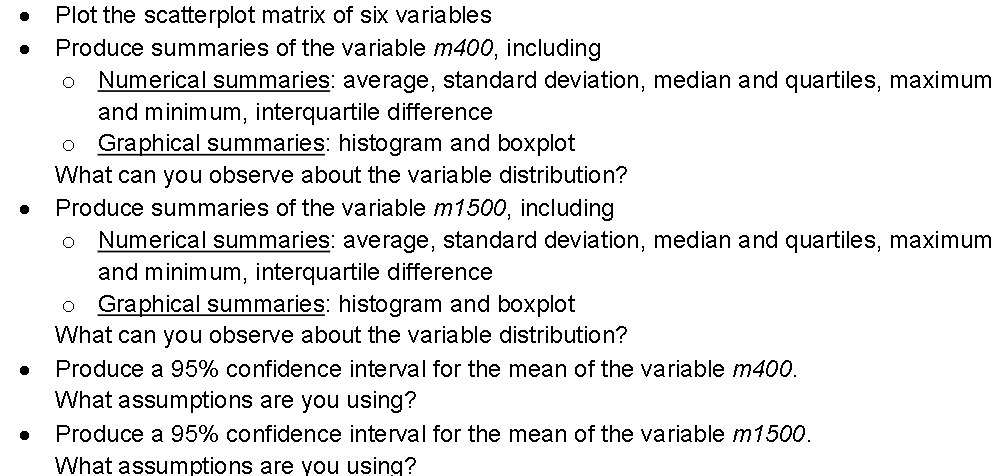
Plot the scatterplot matrix of six variables Produce summaries of the variable m400, including 0 Numerical summaries: average, standard deviation, median and quartiles, maximum and minimum, interquartile difference 0 Graphical summaries: histogram and boxplot What can you observe about the variable distribution? Produce summaries of the variable m1500, including 0 Numerical summaries: average, standard deviation, median and quartiles, maximum and minimum, interquartile difference 0 Graphical summaries: histogram and boxplot What can you observe about the variable distribution? Produce a 95% confidence interval for the mean of the variable m400. What assumptions are you using? Produce a 95% confidence interval for the mean of the variable m1500. What assumptions are you using
Step by Step Solution
There are 3 Steps involved in it

Get step-by-step solutions from verified subject matter experts