

Question: plot the values on the same graph by excel D B 1.7372 1.9778 2.11083 2.17414 2.5 3.5 4.5 5.5 6.5 7.5 8.5 9.5 10.5 2.19473
plot the values on the same graph by excel 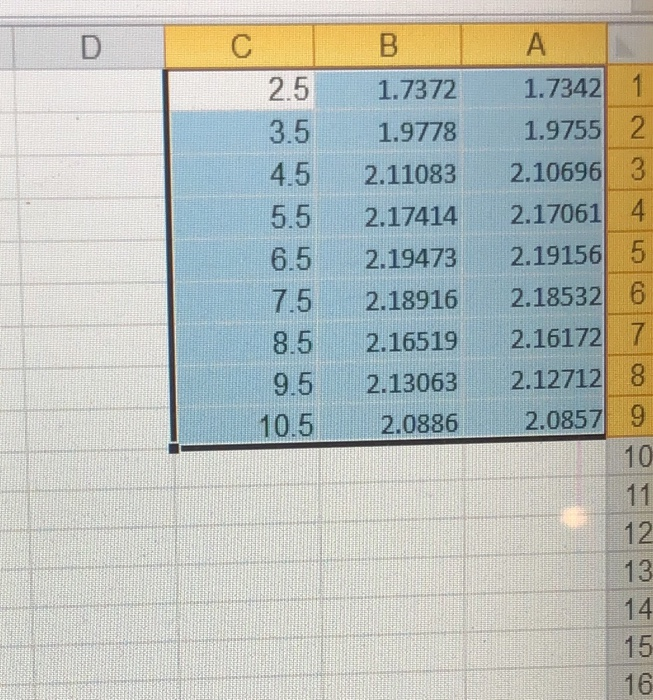
D B 1.7372 1.9778 2.11083 2.17414 2.5 3.5 4.5 5.5 6.5 7.5 8.5 9.5 10.5 2.19473 2.18916 2.16519 A 1.7342 1 1.9755 2 2.10696 3 2.170614 2.19156) 5 2.18532 6 2.161727 2.12712 8 2.0857 9 10 11 12 13 14 15 16 2.13063 2.0886 1 1 1 D B 1.7372 1.9778 2.11083 2.17414 2.5 3.5 4.5 5.5 6.5 7.5 8.5 9.5 10.5 2.19473 2.18916 2.16519 A 1.7342 1 1.9755 2 2.10696 3 2.170614 2.19156) 5 2.18532 6 2.161727 2.12712 8 2.0857 9 10 11 12 13 14 15 16 2.13063 2.0886 1 1 1
Step by Step Solution
There are 3 Steps involved in it
1 Expert Approved Answer
Step: 1 Unlock

Question Has Been Solved by an Expert!
Get step-by-step solutions from verified subject matter experts
Step: 2 Unlock
Step: 3 Unlock