

Question: Plot these functions in MATLAB 2. Create a sine function, cosine function, tangentfunction, and cotangentfunction for the range between-4pito 4pi with the interval pi/20. Use
Plot these functions in MATLAB
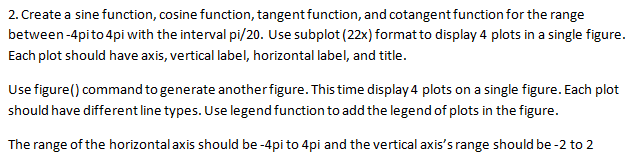
2. Create a sine function, cosine function, tangentfunction, and cotangentfunction for the range between-4pito 4pi with the interval pi/20. Use subplot (22x) format to display 4 plots in a single figure. Each plot should have axis, vertical label, horizontal label, and title Use figure() command to generate another figure. This time display 4 plots on a single figure. Each plot should have different line types. Use legend function to add the legend of plots in the figure. The range of the horizontal axis should be-4pi to 4pi and the vertical axis's range should be -2 to 2
Step by Step Solution
There are 3 Steps involved in it
1 Expert Approved Answer
Step: 1 Unlock

Question Has Been Solved by an Expert!
Get step-by-step solutions from verified subject matter experts
Step: 2 Unlock
Step: 3 Unlock