

Question: Plot this curve with Matlab using this equation. 2 1 + su.edu/bbcswebdav/pid-19753853-dt-content-rid-145906116 1/courses/20195pring-T-EEE544-32228-28824/H3 The relative precision of measurements (log-log scale) 10 -N=10 N=100 --N 10
Plot this curve with Matlab using this equation.
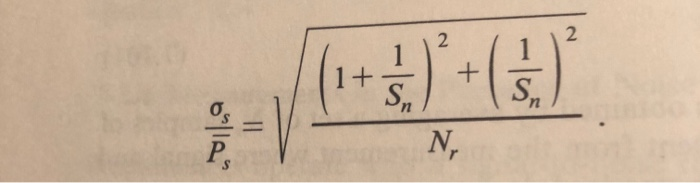
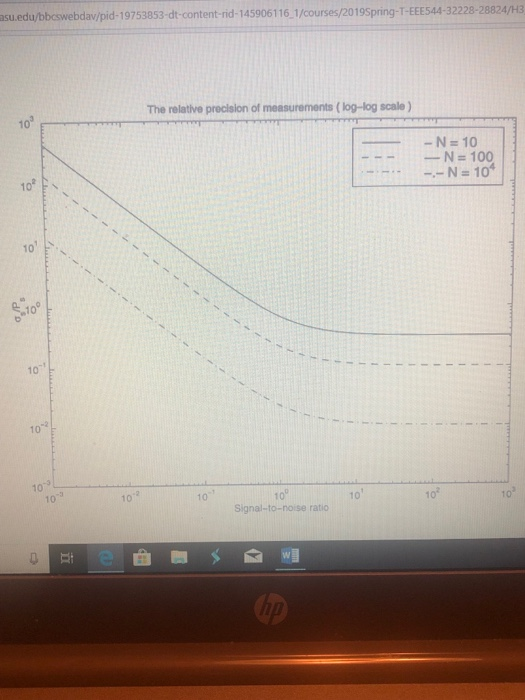
2 1 + su.edu/bbcswebdav/pid-19753853-dt-content-rid-145906116 1/courses/20195pring-T-EEE544-32228-28824/H3 The relative precision of measurements (log-log scale) 10 -N=10 N=100 --N 10 10 E 10- 10 103 10' 10 Signal-to-noise ratio 10 10 10 10
Step by Step Solution
There are 3 Steps involved in it
1 Expert Approved Answer
Step: 1 Unlock

Question Has Been Solved by an Expert!
Get step-by-step solutions from verified subject matter experts
Step: 2 Unlock
Step: 3 Unlock