

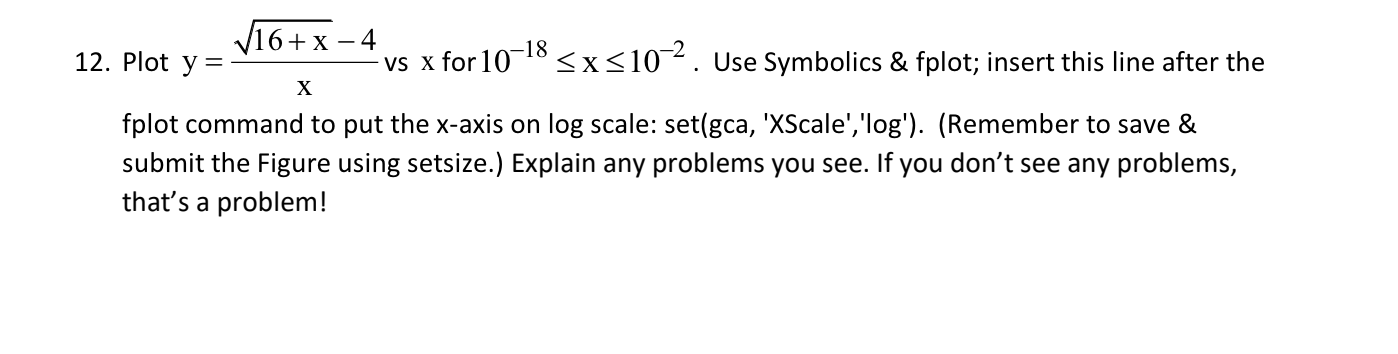
Question: Plot y = 1 6 + x 2 - 4 x vs x for 1 0 - 1 8 x 1 0 - 2 .
Plot vs for Use Symbolics & fplot; insert this line after the
fplot command to put the axis on log scale: setgca 'XScale','log'Remember to save &
submit the Figure using setsize. Explain any problems you see. If you don't see any problems,
that's a problem! USE MATLAB
Step by Step Solution
There are 3 Steps involved in it
1 Expert Approved Answer
Step: 1 Unlock

Question Has Been Solved by an Expert!
Get step-by-step solutions from verified subject matter experts
Step: 2 Unlock
Step: 3 Unlock