

Question: plotting. Create a bar plot that shows the highest review score for each ramen type by grouping by style and using the max() method
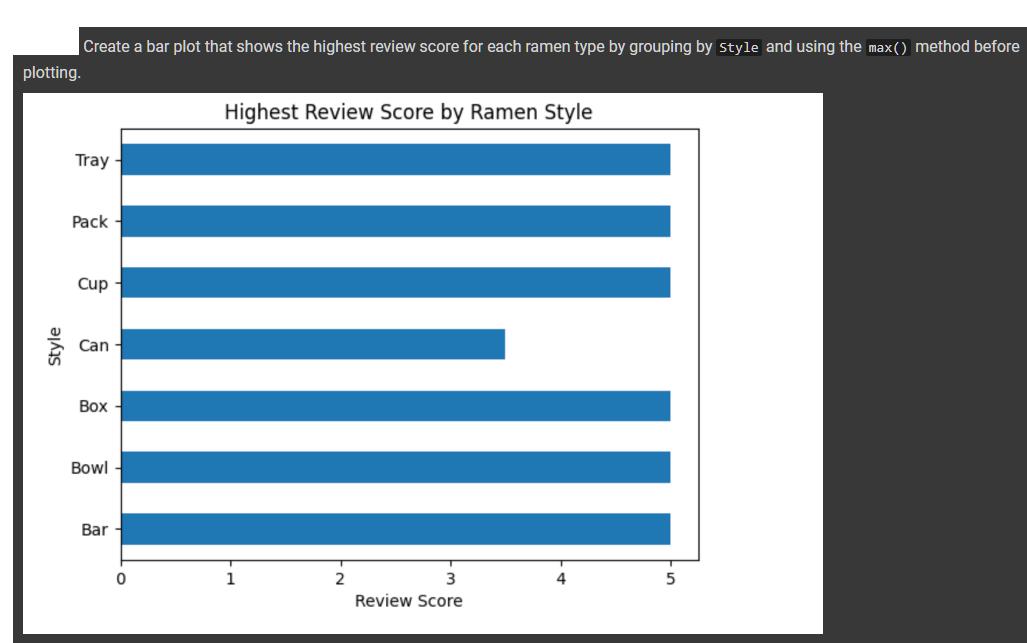
plotting. Create a bar plot that shows the highest review score for each ramen type by grouping by style and using the max() method before Tray Highest Review Score by Ramen Style Style Pack Cup Can Box Bowl Bar 0 1 2 3 Review Score 5
Step by Step Solution
There are 3 Steps involved in it
1 Expert Approved Answer
Step: 1 Unlock

Question Has Been Solved by an Expert!
Get step-by-step solutions from verified subject matter experts
Step: 2 Unlock
Step: 3 Unlock