

Question: Pls answer D through F. Flextrola, Inc., an electronics systems integrator, is planning to design a key component for its next-generation product with Solectrics. Flextrola
Pls answer D through F.
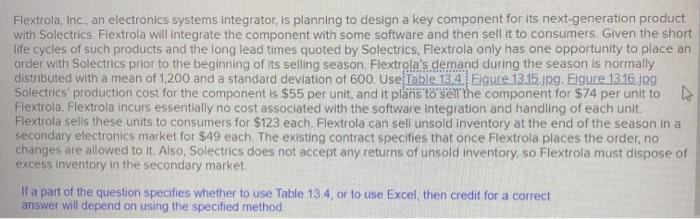
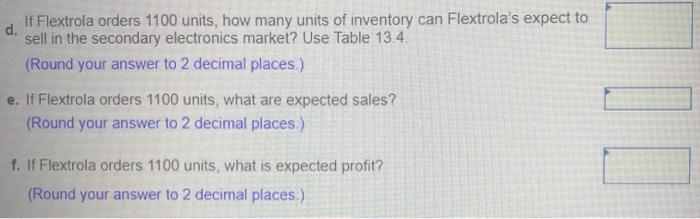
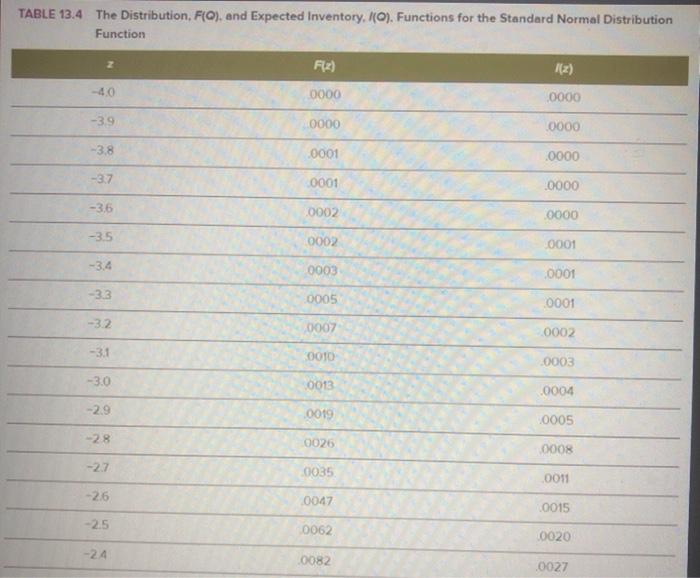
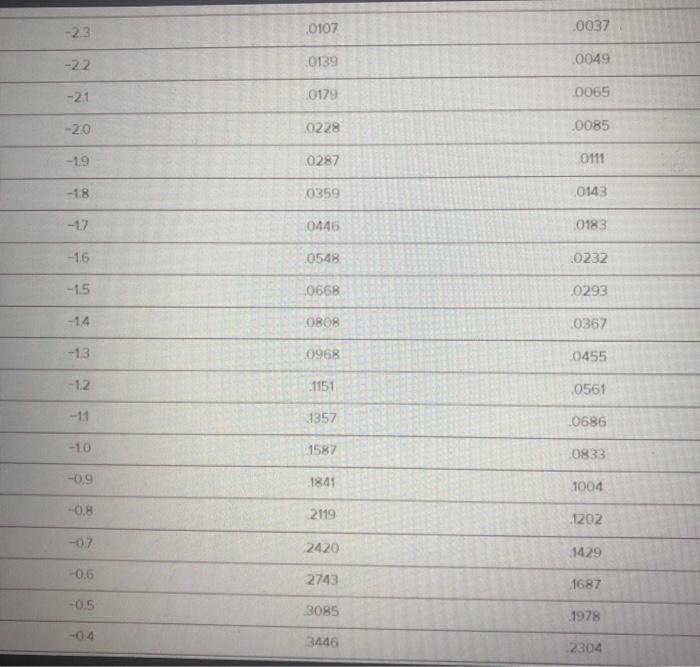
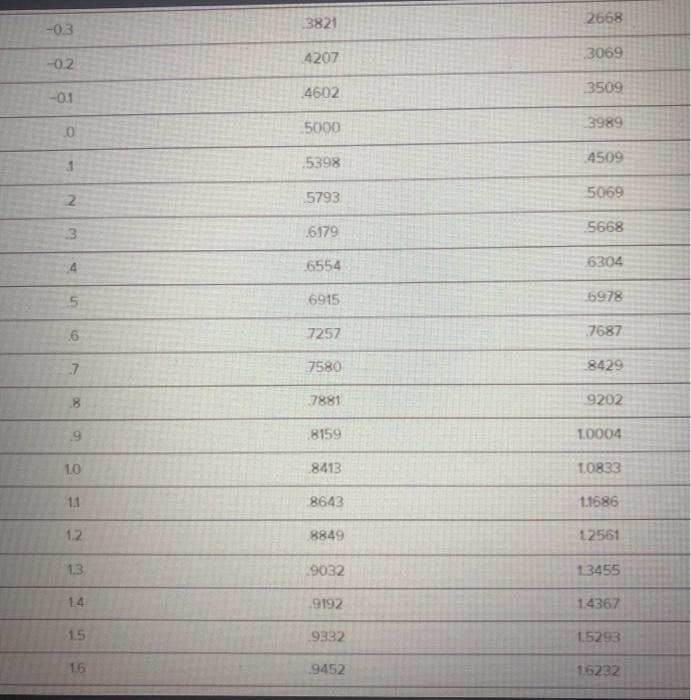
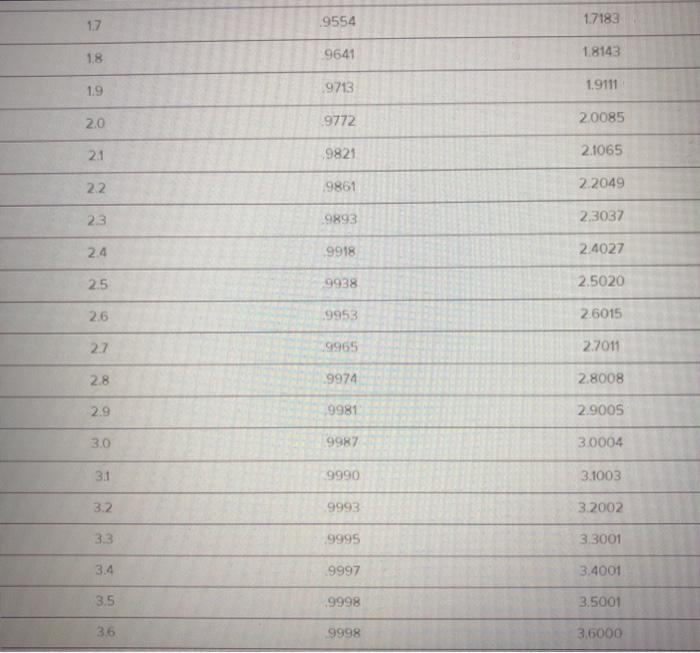
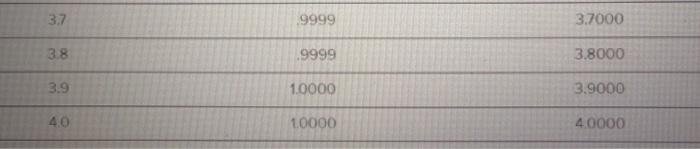
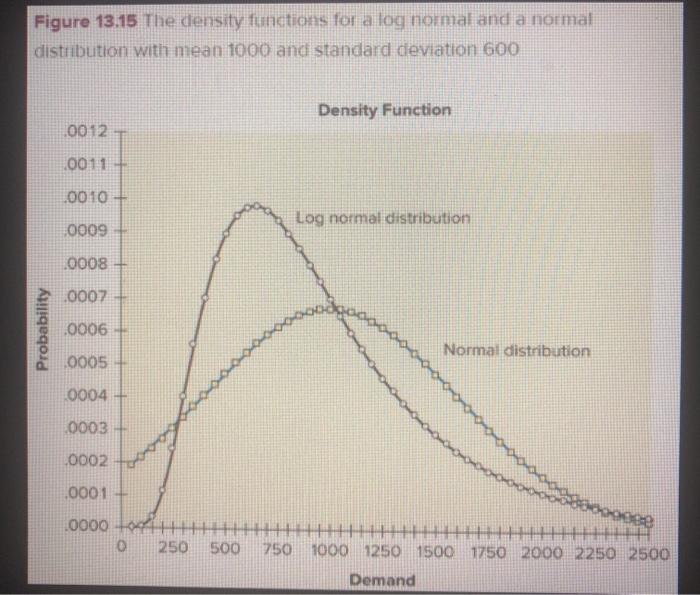
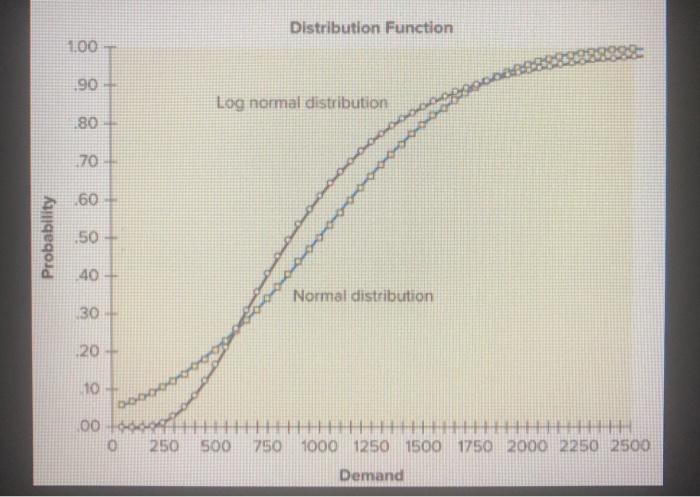
Flextrola, Inc., an electronics systems integrator, is planning to design a key component for its next-generation product with Solectrics. Flextrola will integrate the component with some software and then sell it to consumers. Given the short life cycles of such products and the long lead times quoted by Solectrics, Flextrola only has one opportunity to place an order with Solectrics prior to the beginning of its selling season, Flextrola's demand during the season is normally distributed with a mean of 1,200 and a standard deviation of 600. Use Table 134. Elgure 13.15.jpg, Figure 13.16.jpg Solectrics production cost for the component is $55 per unit, and it plans to set the component for $74 per unit to D. Flextrola. Flextrola incurs essentially no cost associated with the software Integration and handling of each unit Flextrola sells these units to consumers for $123 each Flextrola can sell unsold inventory at the end of the season in a secondary electronics market for $49 each. The existing contract specifies that once Flextrola places the order, no changes are allowed to it. Also, Solectrics does not accept any returns of unsold inventory, so Flextrola must dispose of excess inventory in the secondary market If a part of the question specifies whether to use Table 134, or to use Excel, then credit for a correct answer will depend on using the specified method d. If Flextrola orders 1100 units, how many units of inventory can Flextrola's expect to sell in the secondary electronics market? Use Table 13.4 (Round your answer to 2 decimal places.) e. If Flextrola orders 1100 units, what are expected sales? (Round your answer to 2 decimal places) f. If Flextrola orders 1100 units, what is expected profit? (Round your answer to 2 decimal places) TABLE 13.4 The Distribution, F(Q), and Expected Inventory, MO). Functions for the Standard Normal Distribution Function Fiz) 0000 0000 -39 0000 0000 -3,8 0001 .0000 -3.7 0001 0000 -36 0002 0000 -3.5 0002 0001 -3.4 0003 0001 -3.3 0005 0001 -3.2 0007 0002 -3.1 CO010 0003 -3.0 0013 .0004 -2.9 0019 0005 -28 0026 0008 -27 0035 0011 -26 0047 L0015 -25 0062 0020 -24 0082 0027 -23 0107 0037 -22 0139 0049 -2.1 .0179 0065 -2.0 0228 .0085 -19 0287 0111 -1.8 0359 0143 -17 0446 0183 0548 10232 -1.5 .0668 0293 -14 0808 0367 -13 0968 0455 -1.2 1151 0561 1357 0686 -10 1587 0833 -09 1841 1004 -0.8 2119 1202 -0.7 2420 1429 -0.6 2743 1687 -0.5 3085 1978 3446 2304 -03 3821 2668 -0.2 4207 3069 -0.1 4602 3509 5000 3989 0 5398 4509 1 2 5793 5069 13 6179 5668 6554 6304 5 6915 6978 .6 7257 .7687 7 7580 8429 7881 9202 9 8159 1.0004 1.0 8413 1.0833 1.1 8643 1.1686 12 8849 12561 1.3 9032 13455 14 9192 1.4367 1.5 9332 1.5293 16 9452 16232 1.7 9554 1.7183 18 9641 1.8143 19 9713 1.9111 2.0 9772 20085 2.1 9821 2.1065 22 9861 2.2049 23 9893 2.3037 24 9918 2.4027 2.5 9938 2.5020 2.6 9953 2.6015 2.7 9965 27011 2.8 9974 2.8008 2.9 9981 2009 3.0 9987 3.0004 31 9990 3.1003 3.2. 9993 3.2002 33 9995 3.3001 3.4 9997 3.4001 3.5 9998 3.5001 36 9998 3.6000 3.7 9999 3.7000 3.8 .9999 3.8000 3.9 1.0000 3.9000 40 10000 4.0000 Figure 13.15 The density functions for a log normal and a normal distribution with mean 1000 and standard deviation 600 Density Function 0012 0011 0010 Log normal distribution 0009 0008 0007 Probability 1.0006 Normal distribution 0005 0004 0003 O 0002 0001 10000 OH 0 250 HHHHHHHHHHH 750 1000 1250 1500 1750 2000 2250 2500 500 Demand Distribution Function 100 90 Log normal distribution 180 70 60 Probability 50 mom 40 Normal distribution 30 20+ 10 00 0 250 500 750 HHHHHHH HHH 1000 1250 1500 1750 2000 2250 2500 Demand Step by Step Solution
There are 3 Steps involved in it
1 Expert Approved Answer
Step: 1 Unlock

Question Has Been Solved by an Expert!
Get step-by-step solutions from verified subject matter experts
Step: 2 Unlock
Step: 3 Unlock