

Question: pls answer only if you know the steps and formulas. donot use chat gpt. Q1. Fill the next table appropriately then draw the OC curve
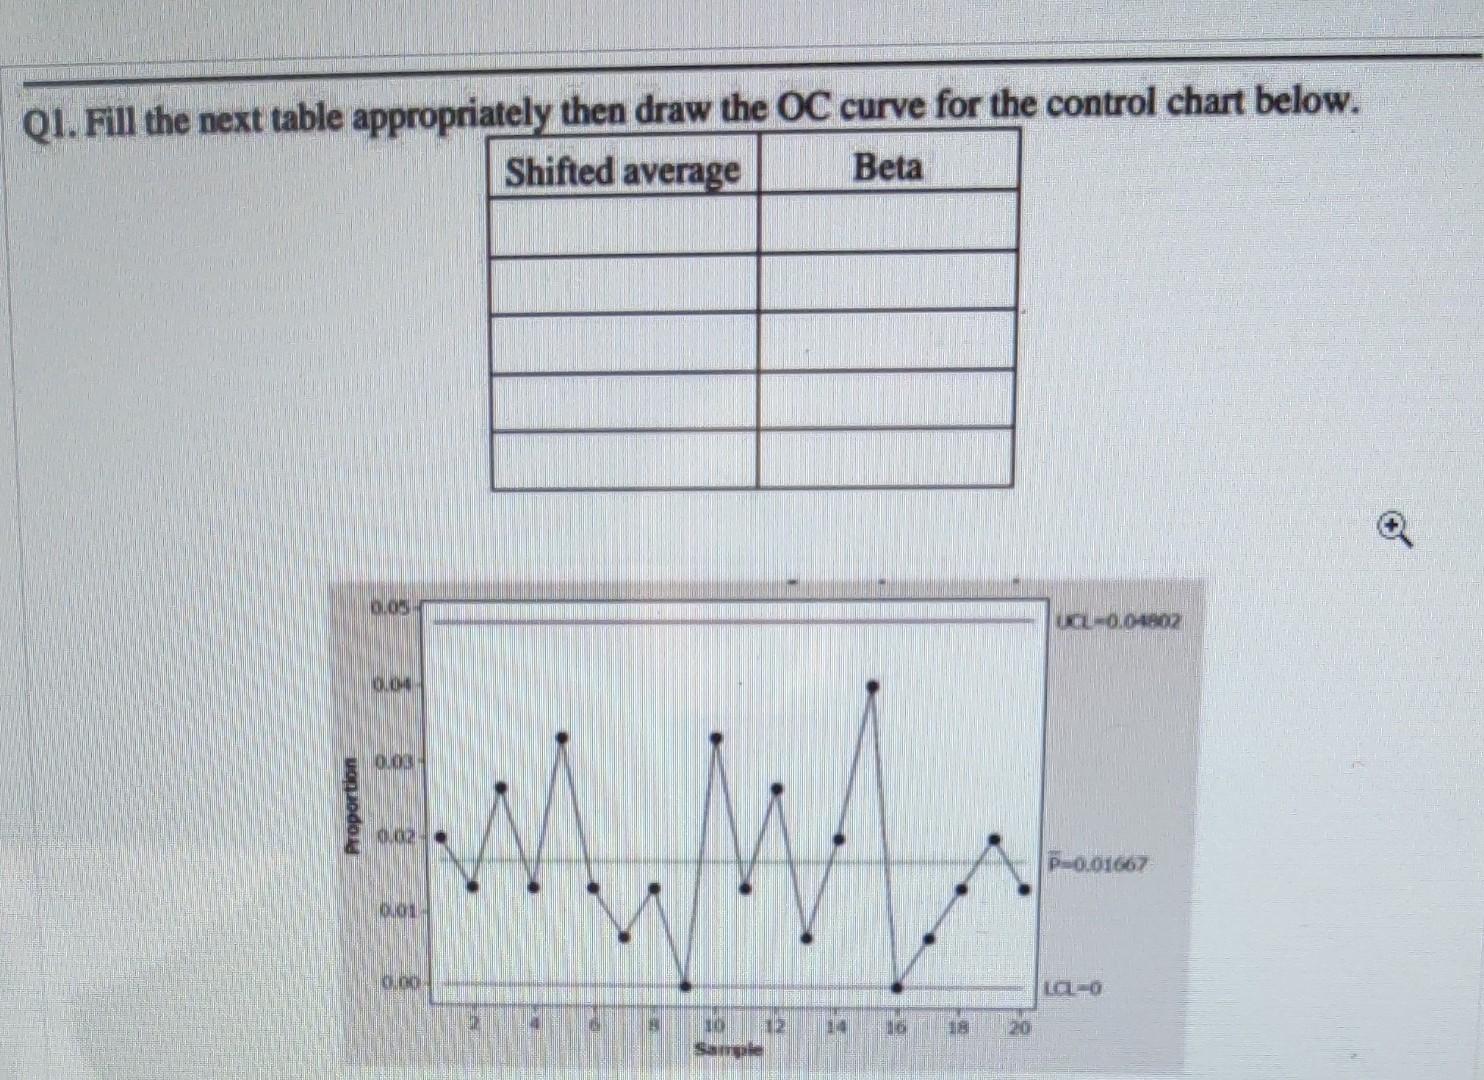
pls answer only if you know the steps and formulas. donot use chat gpt. Q1. Fill the next table appropriately then draw the OC curve for the control chart below. Shifted average Beta 0.05- 0.04 0.03 0.02 0.01 0.00- IN TO 12 14 18 20 UCL-0.04802 -0.01667 LCL-O
Q1. Fill the next table appropriatelv then draw the OC curve for the control chart below. Q1. Fill the next table appropriatelv then draw the OC curve for the control chart below
Step by Step Solution
There are 3 Steps involved in it
1 Expert Approved Answer
Step: 1 Unlock

Question Has Been Solved by an Expert!
Get step-by-step solutions from verified subject matter experts
Step: 2 Unlock
Step: 3 Unlock