

Question: pls answer the analysis colum 1. Sweet Candy Corp. has prepared the following financial statements: Sweet Candy Corp Sweet Candy Corp. Income Statement Balance Sheet
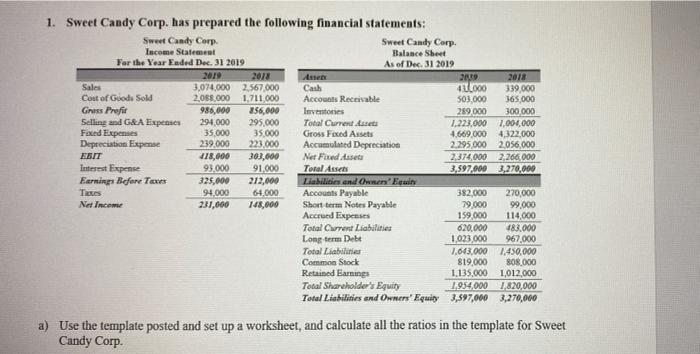
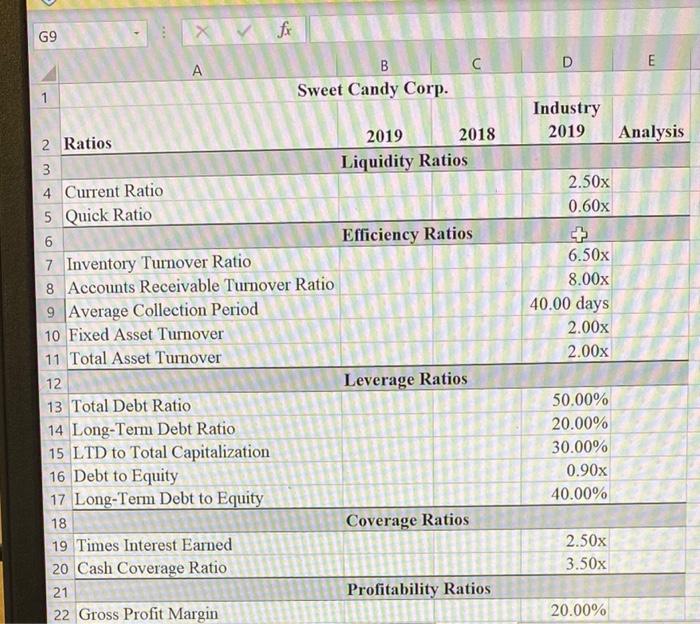
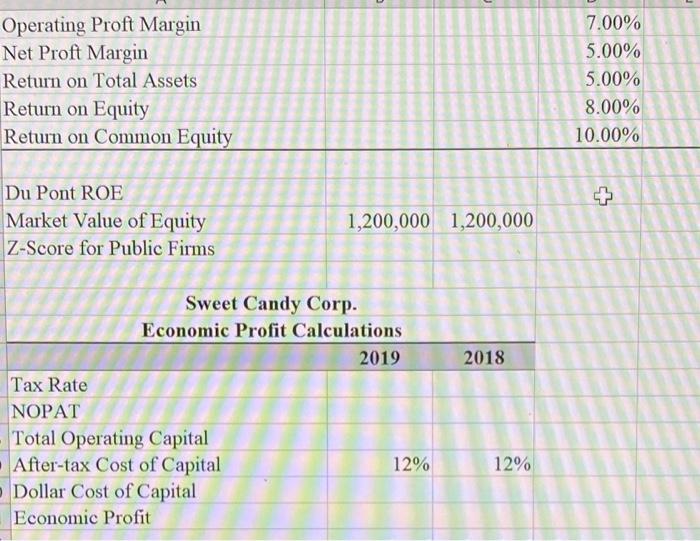
1. Sweet Candy Corp. has prepared the following financial statements: Sweet Candy Corp Sweet Candy Corp. Income Statement Balance Sheet For the Year Ended Dec. 31 2019 As of Dec. 31 2019 2019 2013 AS 29 2018 Sales 3,074,000 2.567.000 Cash 416000 339.000 Cost of Goods Sold 2,068,000 1,711,000 Accounts Receivable 503,000 365,000 Grass Prefir 986,000 856,000 Investones 289.000 300,000 Selling and G&A Expenses 294,000 295.000 Total Current 1.223.000 2.000.000 Fixed Expenses 35,000 35.000 Gross Fixed Assets 4,669.000 4,322,000 Depreciation Expense 239.000 223.000 Accumulated Depreciation 2.295.000 2.056,000 ESIT 418,000 303,000 Net Fixed Asses 2,374,000 2,266,000 interest Expense 93,000 91.000 Total Assets 3,597,000 3,270,000 Earnings Before Texas 325,000 212,000 Liabilities and we'Equin 94.000 64.000 Accounts Payable 382.000 270,000 Net Income 231,000 148,000 Short term Notes Payable 79.000 99.000 Accrued Expenses 159,000 114,000 Total Curent Liabilities 620,000 483.000 Long term Debt 1,023,000 967,000 Total Liabilities 1.643,000 1,450,000 Common Stock 819,000 808.000 Retained Earnings 1.135.000 1,012.000 Total Shareholder's Equity 1954.000 1.820,000 Total Liabilities and Owners' Equity 3,597,000 3,270,000 a) Use the template posted and set up a worksheet, and calculate all the ratios in the template for Sweet Candy Corp G9 X Fix D E B Sweet Candy Corp. 1 Industry 2019 Analysis 2.50x 0.60x 6.50x 8.00x 40.00 days 2.00x 2.00x 2 Ratios 2019 2018 3 Liquidity Ratios 4 Current Ratio 5 Quick Ratio 6 Efficiency Ratios 7 Inventory Turnover Ratio 8 Accounts Receivable Turnover Ratio 9 Average Collection Period 10 Fixed Asset Turnover 11 Total Asset Turnover 12 Leverage Ratios 13 Total Debt Ratio 14 Long-Term Debt Ratio 15 LTD to Total Capitalization 16 Debt to Equity 17 Long-Term Debt to Equity 18 Coverage Ratios 19 Times Interest Earned 20 Cash Coverage Ratio 21 Profitability Ratios 22 Gross Profit Margin 50.00% 20.00% 30.00% 0.90x 40.00% 2.50x 3.50x 20.00% Operating Proft Margin Net Proft Margin Return on Total Assets Return on Equity Return on Common Equity 7.00% 5.00% 5.00% 8.00% 10.00% c? Du Pont ROE Market Value of Equity Z-Score for Public Firms 1,200,000 1,200,000 2018 Sweet Candy Corp. Economic Profit Calculations 2019 Tax Rate NOPAT Total Operating Capital After-tax Cost of Capital 12% Dollar Cost of Capital Economic Profit 12%
Step by Step Solution
There are 3 Steps involved in it

Get step-by-step solutions from verified subject matter experts