

Question: Pls be fast thanks 5. (25 points). The function polar generate a 2D plot in polar coordinates For example, the following polar plot (left) describes
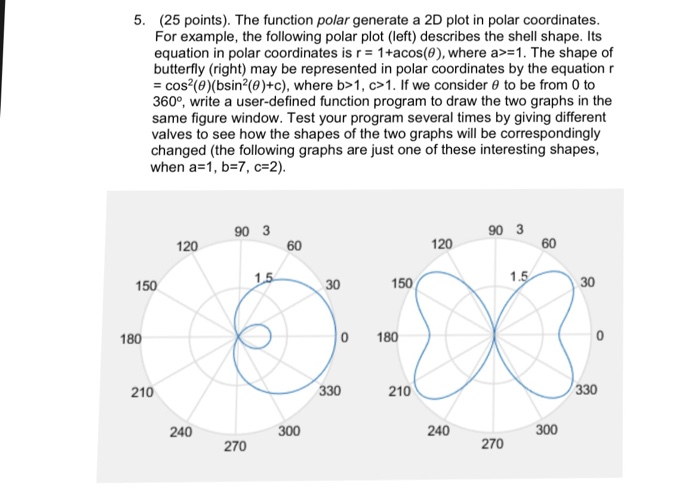
5. (25 points). The function polar generate a 2D plot in polar coordinates For example, the following polar plot (left) describes the shell shape. Its equation in polar coordinates is r1+acos(0), where a-1. The shape of butterfly (right) may be represented in polar coordinates by the equation r cos (9) (bsin2(0)+c), where b>1, c>1. If we consider 0 to be from 0 to 360, write a user-defined function program to draw the two graphs in the same figure window. Test your program several times by giving different valves to see how the shapes of the two graphs will be correspondingly changed (the following graphs are just one of these interesting shapes when a#1, b-7, c-2) 90 3 120 60 120 60 150 30 150 30 180 0 180 210 330 210 330 240 240 270 300 5. (25 points). The function polar generate a 2D plot in polar coordinates For example, the following polar plot (left) describes the shell shape. Its equation in polar coordinates is r1+acos(0), where a-1. The shape of butterfly (right) may be represented in polar coordinates by the equation r cos (9) (bsin2(0)+c), where b>1, c>1. If we consider 0 to be from 0 to 360, write a user-defined function program to draw the two graphs in the same figure window. Test your program several times by giving different valves to see how the shapes of the two graphs will be correspondingly changed (the following graphs are just one of these interesting shapes when a#1, b-7, c-2) 90 3 120 60 120 60 150 30 150 30 180 0 180 210 330 210 330 240 240 270 300
Step by Step Solution
There are 3 Steps involved in it

Get step-by-step solutions from verified subject matter experts