

Question: PLS help answer this question: Continue the operating profit and cash flow graph from operation presented in Case Part B to cover the figures in

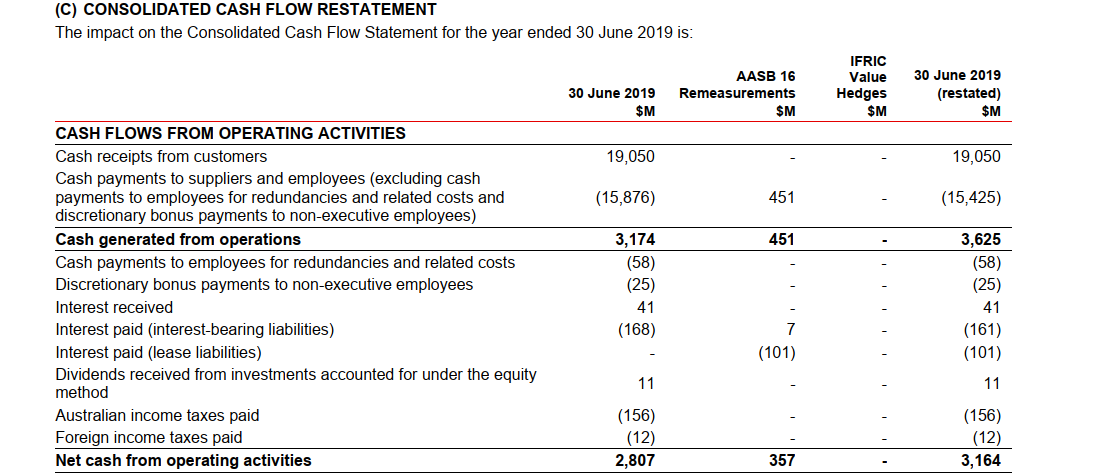
PLS help answer this question: Continue the operating profit and cash flow graph from operation presented in Case Part B to cover the figures in 2020. Discuss the importance of analysing the two figures. Also, compare operating profit to operating cash flow.
Pls attached the file below. Thanks
- Operating profit and cash flow graph
- Operating profit 2019
- Operating profit 2020
- cash flow restatement
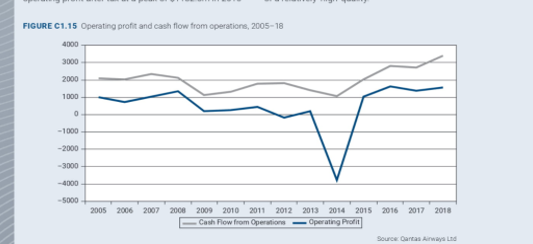
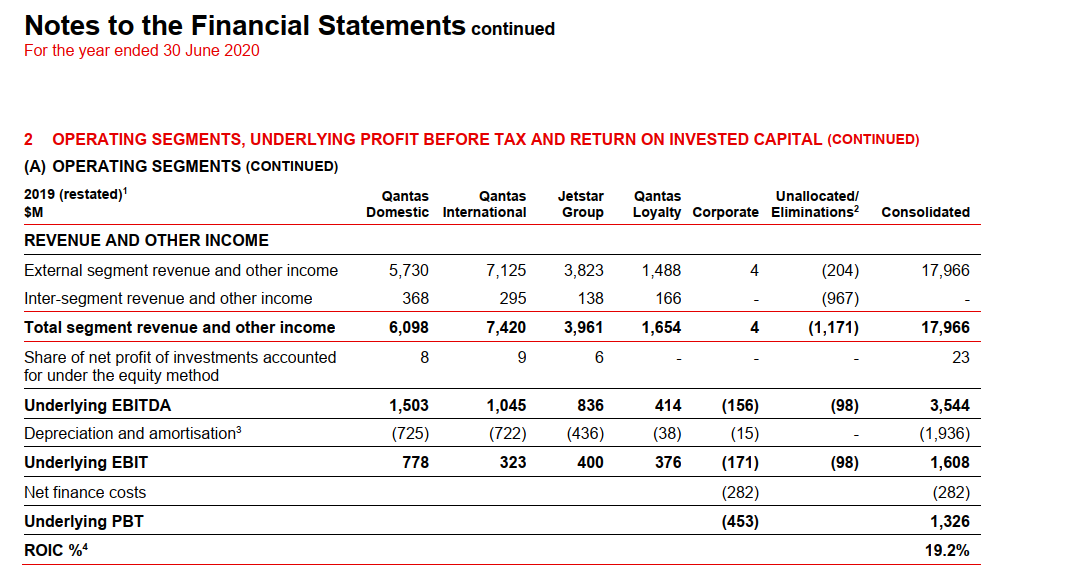
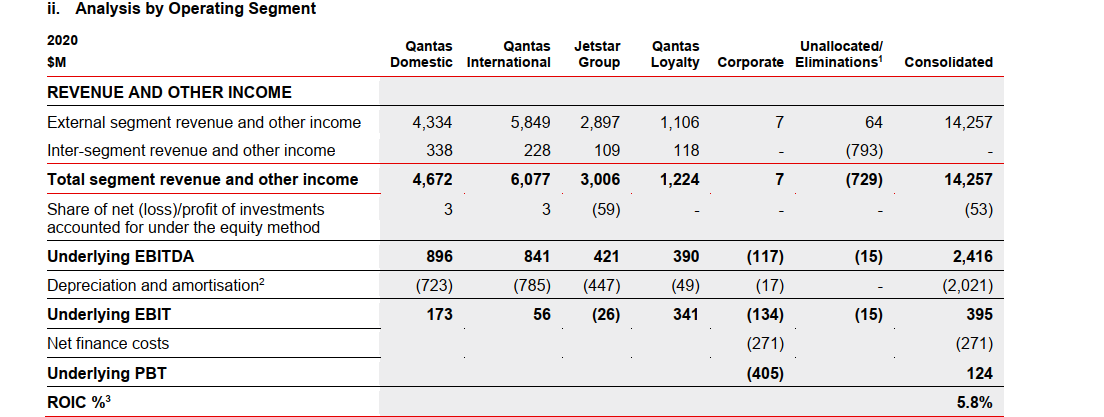

FIGURE C1.15 Operating profit and cash flow from operations, 2005-18 3000 2000 1000 1000 -2000 -3000 -4000 -5000 2005 2006 2007 2008 2009 2010 2011 2012 2013 2014 2015 2016 2017 2018 - Cash Flow from Operations - Operating Profit Sourcec Qantas Airways UndNotes to the Financial Statements continued For the year ended 30 June 2020 2 OPERATING SEGMENTS, UNDERLYING PROFIT BEFORE TAX AND RETURN ON INVESTED CAPITAL (CONTINUED) (A) OPERATING SEGMENTS (CONTINUED) 2019 (restated)' Qantas Qantas Jetstar Qantas Unallocated/ $M Domestic International Group Loyalty Corporate Eliminations Consolidated REVENUE AND OTHER INCOME External segment revenue and other income 5,730 7,125 3,823 1,488 4 (204) 17,966 Inter-segment revenue and other income 368 295 138 166 (967) Total segment revenue and other income 6,098 7,420 3,961 1,654 4 (1,171) 17,966 Share of net profit of investments accounted 8 9 6 23 for under the equity method Underlying EBITDA 1,503 1,045 836 414 (156) (98) 3.544 Depreciation and amortisation3 (725) (722) (436) (38) (15) (1,936) Underlying EBIT 778 323 400 376 (171) (98) 1,608 Net finance costs (282) (282) Underlying PBT (453) 1,326 ROIC %4 19.2%ii. Analysis by Operating Segment 2020 Qantas Qantas Jetstar Qantas Unallocated/ $M Domestic International Group Loyalty Corporate Eliminations Consolidated REVENUE AND OTHER INCOME External segment revenue and other income 4,334 5.849 2,897 1,106 64 14,257 Inter-segment revenue and other income 338 228 109 118 I (793) Total segment revenue and other income 4,672 6,077 3,006 1,224 (729) 14,257 Share of net (loss)/profit of investments 3 3 (59) (53) accounted for under the equity method Underlying EBITDA 896 841 421 390 (117) (15) 2,416 Depreciation and amortisation (723) (785) (447) (49) (17) (2,021) Underlying EBIT 173 56 (26) 341 (134) (15) 395 Net finance costs (271) (271) Underlying PBT (405) 124 ROIC %3 5.8%(C) CONSOLIDATED CASH FLOW RESTATEHENT The impact on the Consolidated Cash Flow Statement for the year ended 30 June 2019 is: M53 16 Elli: 30 June 2019 36 Ju ne 2619 Remeasuremems Hedges (rest-ted} SM SH SH SM CASH FLOWS FROM OPERATING ACTIVITIES Cash receipts from customers 19,050 19,050 Cash payments to suppliers and employees (excluding cash payments to employees for redundancies and related costs and (15,876) 451 (15,425) discretionary bonus payments to nonexecutive employees) Cash generated from operations 3,174 451 - 3,625 Cash payments to employees for redundancies and related costs (58) (58) Discretionary bonus payments to nonexecutive employees (25) (25) Interest received 41 41 Interest paid (interestbearing liabilities) (168) 7 (161) Interest paid (lease liabilities) - (101) - (101) Dividends received from investments accounted for under the equity 11 _ _ 11 method Australian income taxes paid (156) (156) Foreign income taxes paid (12) (12) Net cash from operating activities 2,807 357 - 3,164
Step by Step Solution
There are 3 Steps involved in it

Get step-by-step solutions from verified subject matter experts