

Question: pls help me with upper control limit (UCLr), Lower control limit (LCLr) and wire cutting process. thanks Based on the sampling done, the control limits
 pls help me with upper control limit (UCLr), Lower control limit (LCLr) and wire cutting process. thanks
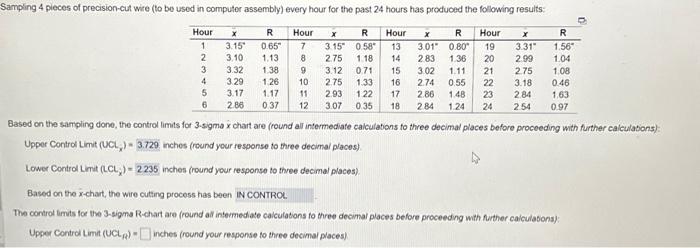
Based on the sampling done, the control limits for 3-sigma x chart are (round all intermediate calculations fo three decimal places before proceeding with further calculations): Upper Control Limit (UCL, =3.729 inches (round your response to three decima/ places) Lower Control Limit (LCLx)=2235 inches (round your response to three decimal places). Based on the x-chart, the wre cutting process has been The control limits foe the 3-sigms R-chart are (round al intermedate calculations to three decimal places before proceeding with further calculabons): Upper Control Limt (UCLR)= inches (round your response to three decima/ places)
Step by Step Solution
There are 3 Steps involved in it

Get step-by-step solutions from verified subject matter experts