

Question: pls help! Prior-Year Compensation Workforce Compensation (total $ per year) and Productivity Data Base Wages Incentive Pay Fringe Benefits Total Regular Compensation 1 Overtime Pay
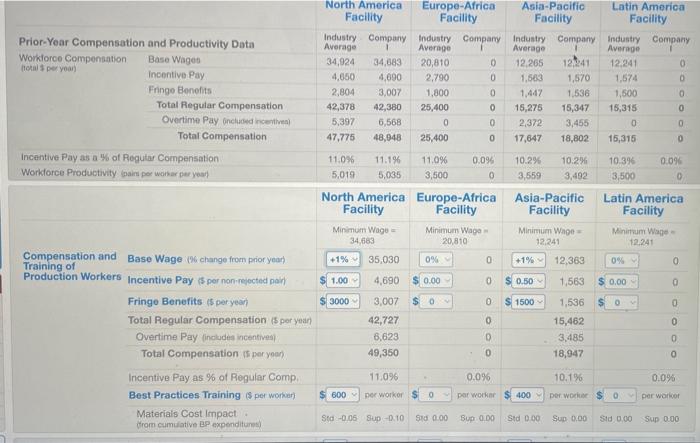
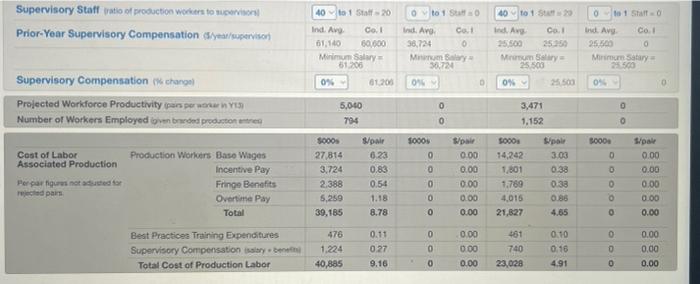
Prior-Year Compensation Workforce Compensation (total $ per year) and Productivity Data Base Wages Incentive Pay Fringe Benefits Total Regular Compensation 1 Overtime Pay included incentives) Total Compensation Incentive Pay as a % of Regular Compensation Workforce Productivity (pairs per workar per year) Compensation and Base Wage (% change from prior year) Training of Production Workers Incentive Pay ($ per non-rejected pair) Fringe Benefits ($ per year) Total Regular Compensation ($ per year) Overtime Pay (includes incentives) Total Compensation ($ per year) Incentive Pay as % of Regular Comp. Best Practices Training ($ per worker) Materials Cost Impact. from cumulative BP expenditures) North America Facility 11.0% 11.1% 5,019 5,035 Industry Company Industry Company Industry Company Average Industry Company Average Average 1 Average 34,924 34,683 20,810 0 12,265 12,241 12,241 1,574 4,650 4,690 2,790 2,804 3,007 1,800 42,378 42,380 25,400 0 1,563 1,570 0 1,447 1,536 1,500 0 15,275 15,347 15,315 0 2,372 3,455 0 17,647 18,802 5,397 6,568 0 0 47,775 48,948 15,315 North America Facility Minimum Wage= 34,683 +1% 35,030 4,690 3,007 42,727 6,623 49,350 $1.00 3000 11.09 600 per worker Europe-Africa Asia-Pacific Facility Facility Std -0.05 Sup -0.10 25,400 11.0% 3,500 Europe-Africa Facility Minimum Wage- 20,810 0% 0.00 0.0% 0 0 V 0 0 0 0 0 0 0 0.0% par worker Sid 0.00 Sup 0.00 10.2% 10.2% 3,559 3,492 Asia-Pacific Facility Minimum Wage- 12,241 +1% 12,363 1,563 1,536 15,462 3,485 18,947 $0.50 1500 10.1% 400 per worker Latin America Facility Std 0.00 Sup 0.00 10.3% 3,500 0% inimum Wage- 12.241 $ 0.00 0 Latin America Facility 0 V Std 0,00 0 0 0 0 0 0 0.0% 0 0 0 0 0 0 0 0.0% per worker Sup 0.00 Supervisory Staff (ratio of production workers to supervisors Prior-Year Supervisory Compensation year/supervisor) Supervisory Compensation (change) Projected Workforce Productivity (pairs per workar in Y13) Number of Workers Employed given branded production entre Cost of Labor Associated Production Per par figures not adjusted for rejected pairs Production Workers Base Wages Incentive Pay Fringe Benefits Overtime Pay Total Best Practices Training Expenditures Supervisory Compensation isalary benefit Total Cost of Production Labor 40 to 1 Staff 20 Ind. Avg. Co. I 61,140 60,600 Minimum Salary 61,206 0% 5,040 794 5000 27,814 3,724 2.388 5,259 39,185 476 1,224 40,885 61,200 S/pair 6.23 0.83 0.54 1.18 8.78 0.11 0.27 9.16 0 to 1 Staff O Co.1 Ind. Avg. 36,724 0 Minimum Salary 36,724 0% $000s S/pair 0 0.00 0.00 0.00 N DOOO 0 0 0 0 0 ... 0 0 0 40 to 1 Staff - 20 Ind. Avg. Co.I 25,500 25,250 Minimum Salary 25,500 0% 3,471 1,152 5000 14,242 1,801 1,769 4,015 0.00 0.00 21,827 0.00 0.00 0.00 23,028 461 740 25,500 S/pair 3.03 0.38 0.38 0.86 4.65 0.10 0.16 4.91 0 to 1 Staff-01 Co.I 0 Minimum Satary= 25.500 Ind. Avg. 25.500 0% 5000 0 ooooo 0 0 OOO 0 0 0 S/pale 0.00 0.00 0.00 0.00 0.00 0.00 0.00 0.00 0 Prior-Year Compensation Workforce Compensation (total $ per year) and Productivity Data Base Wages Incentive Pay Fringe Benefits Total Regular Compensation 1 Overtime Pay included incentives) Total Compensation Incentive Pay as a % of Regular Compensation Workforce Productivity (pairs per workar per year) Compensation and Base Wage (% change from prior year) Training of Production Workers Incentive Pay ($ per non-rejected pair) Fringe Benefits ($ per year) Total Regular Compensation ($ per year) Overtime Pay (includes incentives) Total Compensation ($ per year) Incentive Pay as % of Regular Comp. Best Practices Training ($ per worker) Materials Cost Impact. from cumulative BP expenditures) North America Facility 11.0% 11.1% 5,019 5,035 Industry Company Industry Company Industry Company Average Industry Company Average Average 1 Average 34,924 34,683 20,810 0 12,265 12,241 12,241 1,574 4,650 4,690 2,790 2,804 3,007 1,800 42,378 42,380 25,400 0 1,563 1,570 0 1,447 1,536 1,500 0 15,275 15,347 15,315 0 2,372 3,455 0 17,647 18,802 5,397 6,568 0 0 47,775 48,948 15,315 North America Facility Minimum Wage= 34,683 +1% 35,030 4,690 3,007 42,727 6,623 49,350 $1.00 3000 11.09 600 per worker Europe-Africa Asia-Pacific Facility Facility Std -0.05 Sup -0.10 25,400 11.0% 3,500 Europe-Africa Facility Minimum Wage- 20,810 0% 0.00 0.0% 0 0 V 0 0 0 0 0 0 0 0.0% par worker Sid 0.00 Sup 0.00 10.2% 10.2% 3,559 3,492 Asia-Pacific Facility Minimum Wage- 12,241 +1% 12,363 1,563 1,536 15,462 3,485 18,947 $0.50 1500 10.1% 400 per worker Latin America Facility Std 0.00 Sup 0.00 10.3% 3,500 0% inimum Wage- 12.241 $ 0.00 0 Latin America Facility 0 V Std 0,00 0 0 0 0 0 0 0.0% 0 0 0 0 0 0 0 0.0% per worker Sup 0.00 Supervisory Staff (ratio of production workers to supervisors Prior-Year Supervisory Compensation year/supervisor) Supervisory Compensation (change) Projected Workforce Productivity (pairs per workar in Y13) Number of Workers Employed given branded production entre Cost of Labor Associated Production Per par figures not adjusted for rejected pairs Production Workers Base Wages Incentive Pay Fringe Benefits Overtime Pay Total Best Practices Training Expenditures Supervisory Compensation isalary benefit Total Cost of Production Labor 40 to 1 Staff 20 Ind. Avg. Co. I 61,140 60,600 Minimum Salary 61,206 0% 5,040 794 5000 27,814 3,724 2.388 5,259 39,185 476 1,224 40,885 61,200 S/pair 6.23 0.83 0.54 1.18 8.78 0.11 0.27 9.16 0 to 1 Staff O Co.1 Ind. Avg. 36,724 0 Minimum Salary 36,724 0% $000s S/pair 0 0.00 0.00 0.00 N DOOO 0 0 0 0 0 ... 0 0 0 40 to 1 Staff - 20 Ind. Avg. Co.I 25,500 25,250 Minimum Salary 25,500 0% 3,471 1,152 5000 14,242 1,801 1,769 4,015 0.00 0.00 21,827 0.00 0.00 0.00 23,028 461 740 25,500 S/pair 3.03 0.38 0.38 0.86 4.65 0.10 0.16 4.91 0 to 1 Staff-01 Co.I 0 Minimum Satary= 25.500 Ind. Avg. 25.500 0% 5000 0 ooooo 0 0 OOO 0 0 0 S/pale 0.00 0.00 0.00 0.00 0.00 0.00 0.00 0.00 0
Step by Step Solution
There are 3 Steps involved in it

Get step-by-step solutions from verified subject matter experts