

Question: Pls help to answer this, 7. [Appendix Exercise] The following graph shows the firm's cost-minimizing input choice at current factor prices.a. What are the current
Pls help to answer this,
![Pls help to answer this, 7. [Appendix Exercise] The following graph shows](https://s3.amazonaws.com/si.experts.images/answers/2024/07/6682740c74f0b_4206682740c62a02.jpg)
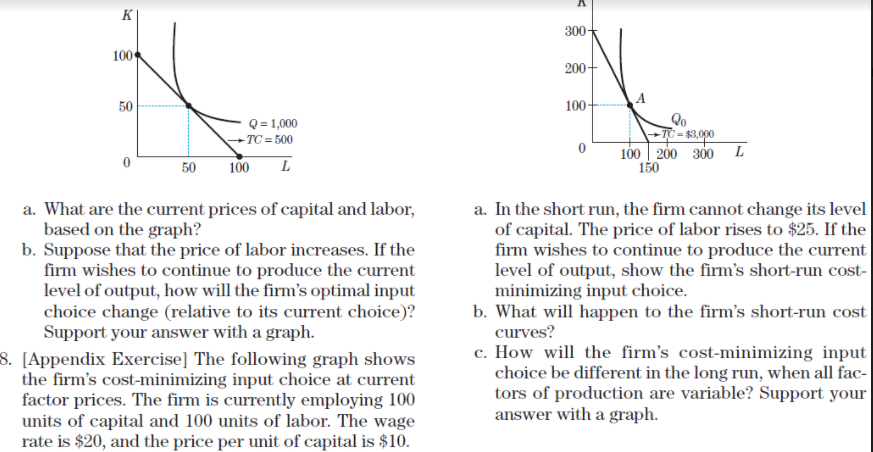
7. [Appendix Exercise] The following graph shows the firm's cost-minimizing input choice at current factor prices.a. What are the current prices of capital and labor1 based on the graph? h. Suppose that the price of labor increases. Ifthe rm wishes to continue to produce the current leVel of output, how will the rm's optimal input choice change (relative to its current choice)? Support your answer with a graph. . [Appendix Exercise] The following graph shows the rm's cost-minimizing input choice at current factor prices The rm is currently employing 100 units of capital and 100 units of labor. The wage rate is $20, and the price per unit of capital is $10. a. In the short run, the rm carmot change its level of capital. The price of labor rises to $25. If the rm wishes to continue to produce the current level of output, show the rm's shorhrun cost- rninirnizing input choice. b. What will happen to the rm's shortrun cost curves? c. How will the rm's cost-minimizing input choice be different in the long run, when all fac tors of production are variable? Support your answer with a. graph
Step by Step Solution
There are 3 Steps involved in it

Get step-by-step solutions from verified subject matter experts