

Question: pls help verify answers. Questions 3 -5 (3 points each): For each set of hypotheses, indicate the matching distribution needed to compute the p-value of
pls help verify answers.
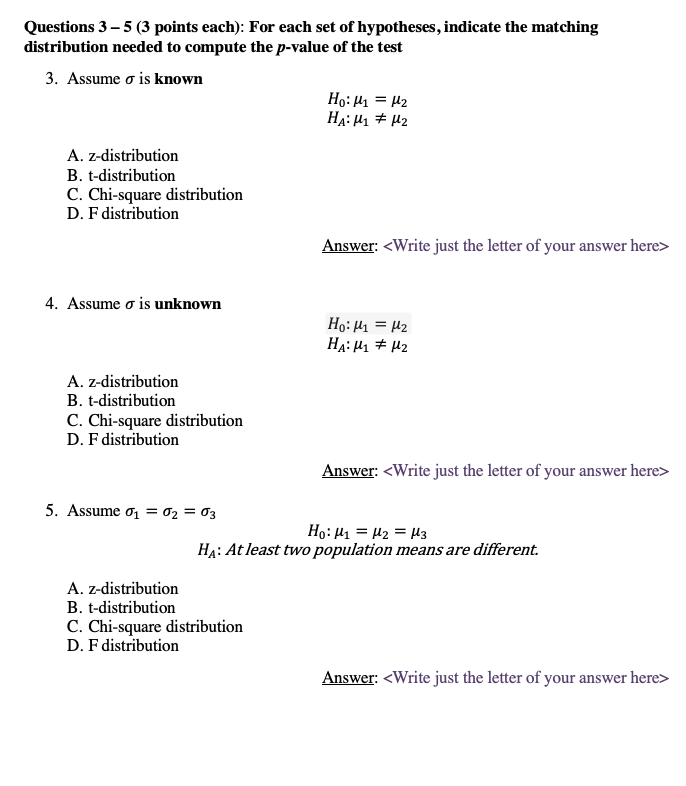
Questions 3 -5 (3 points each): For each set of hypotheses, indicate the matching distribution needed to compute the p-value of the test 3. Assume o is known Ho: 1 = #2 HA: 1 # #2 A. z-distribution B. t-distribution C. Chi-square distribution D. F distribution Answer:
Step by Step Solution
There are 3 Steps involved in it

Get step-by-step solutions from verified subject matter experts