

Question: pls help with questions 2-8 by using the graph i provided. i dont have excel. Name Hondekicksten Section 2 Date 2/1032 Partners LAB Manual Graphing
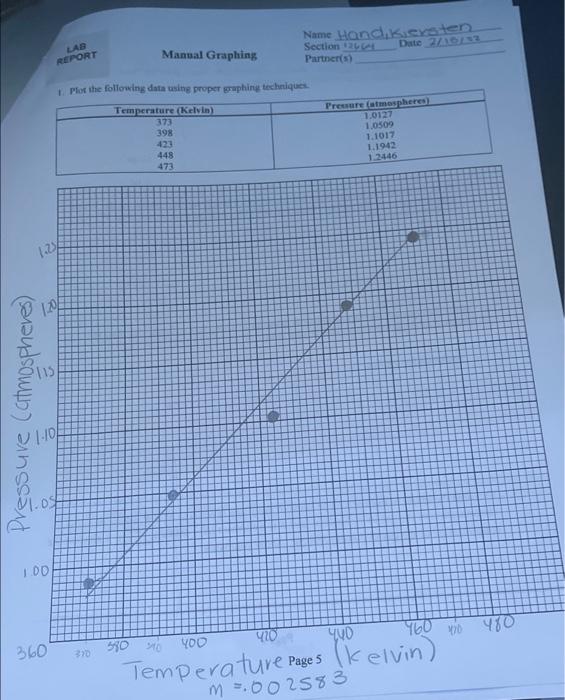
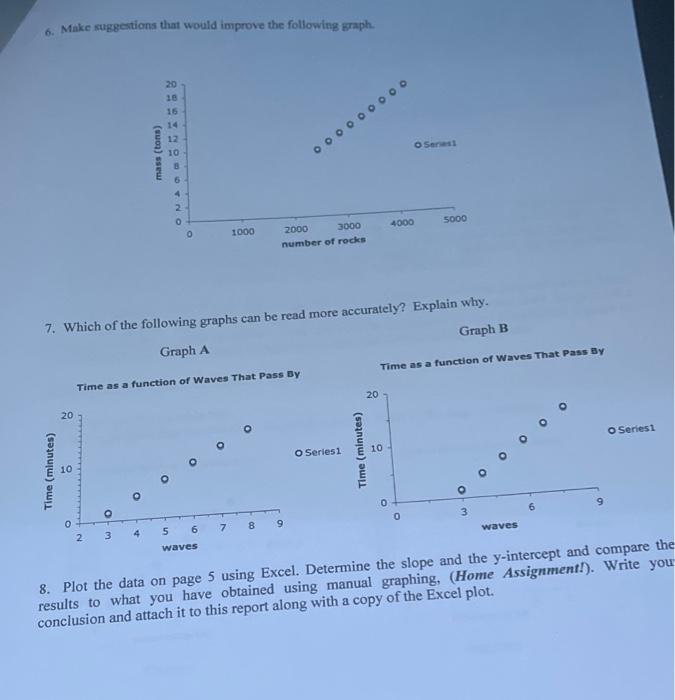
Name Hondekicksten Section 2 Date 2/1032 Partners LAB Manual Graphing REPORT Plot the following data using proper graphing techniques Temperature (Kelvin) 373 398 423 448 473 Pressure atmosphere 1.0127 1.0509 1.1017 1.1942 1.2446 1.24 1204 115 Pressure Catmospheres 1.DD 490 460 YO 480 50 530 360 370 Temperature Pages (kelvin) m=002583 2. Arming the data in question above is expected to be linear, draw the "best" line through data and calculate the Nope and they intercept Slope Y Int. - 3. From the graph you have constructed in questions 1 and 2, which pressure has the largest experimental error: the pressure measured at 423 K or the pressure measured at 473 K? Explain your answer. 4. Write the equation for the line drawn in question 2. Using this equation, calculate the pressure of the gas at 323 K. Show your work. equation for the line: Leatm 5. Examine the graph in Figure 1. The slope of the graph is equal to MXR, where M is the concentration of the gas in moles/liter, and R is a constant (R= 0.0821 -). Calculate the molec concentration of the gas in this experiment. Show your work. 6. Make suggestions that would improve the following graph. 20 Senest mass (tons) 12 10 B 6 4 2 0 4000 5000 1000 2000 3000 number of rocks 7. Which of the following graphs can be read more accurately? Explain why. Graph A Graph B Time as a function of Waves That Pass By Time as a function of Waves That Pass By 20 20 o o Series 1 o O Seriesi Time (minutes) 10 O Time (minutes) 10 o o O o O 9 6 o 3 6 7 8 9 5 waves 2 3 4 waves 8. Plot the data on page 5 using Excel. Determine the slope and the y-intercept and compare the results to what you have obtained using manual graphing, (Home Assignment!). Write you conclusion and attach it to this report along with a copy of the Excel plot
Step by Step Solution
There are 3 Steps involved in it

Get step-by-step solutions from verified subject matter experts