

Question: PLS HELPPPPPPPPP Run a regression analysis on the following bivariate set of data with y as the response variable. X 45.6 50.7 51.7 62.5 44.8
PLS HELPPPPPPPPP
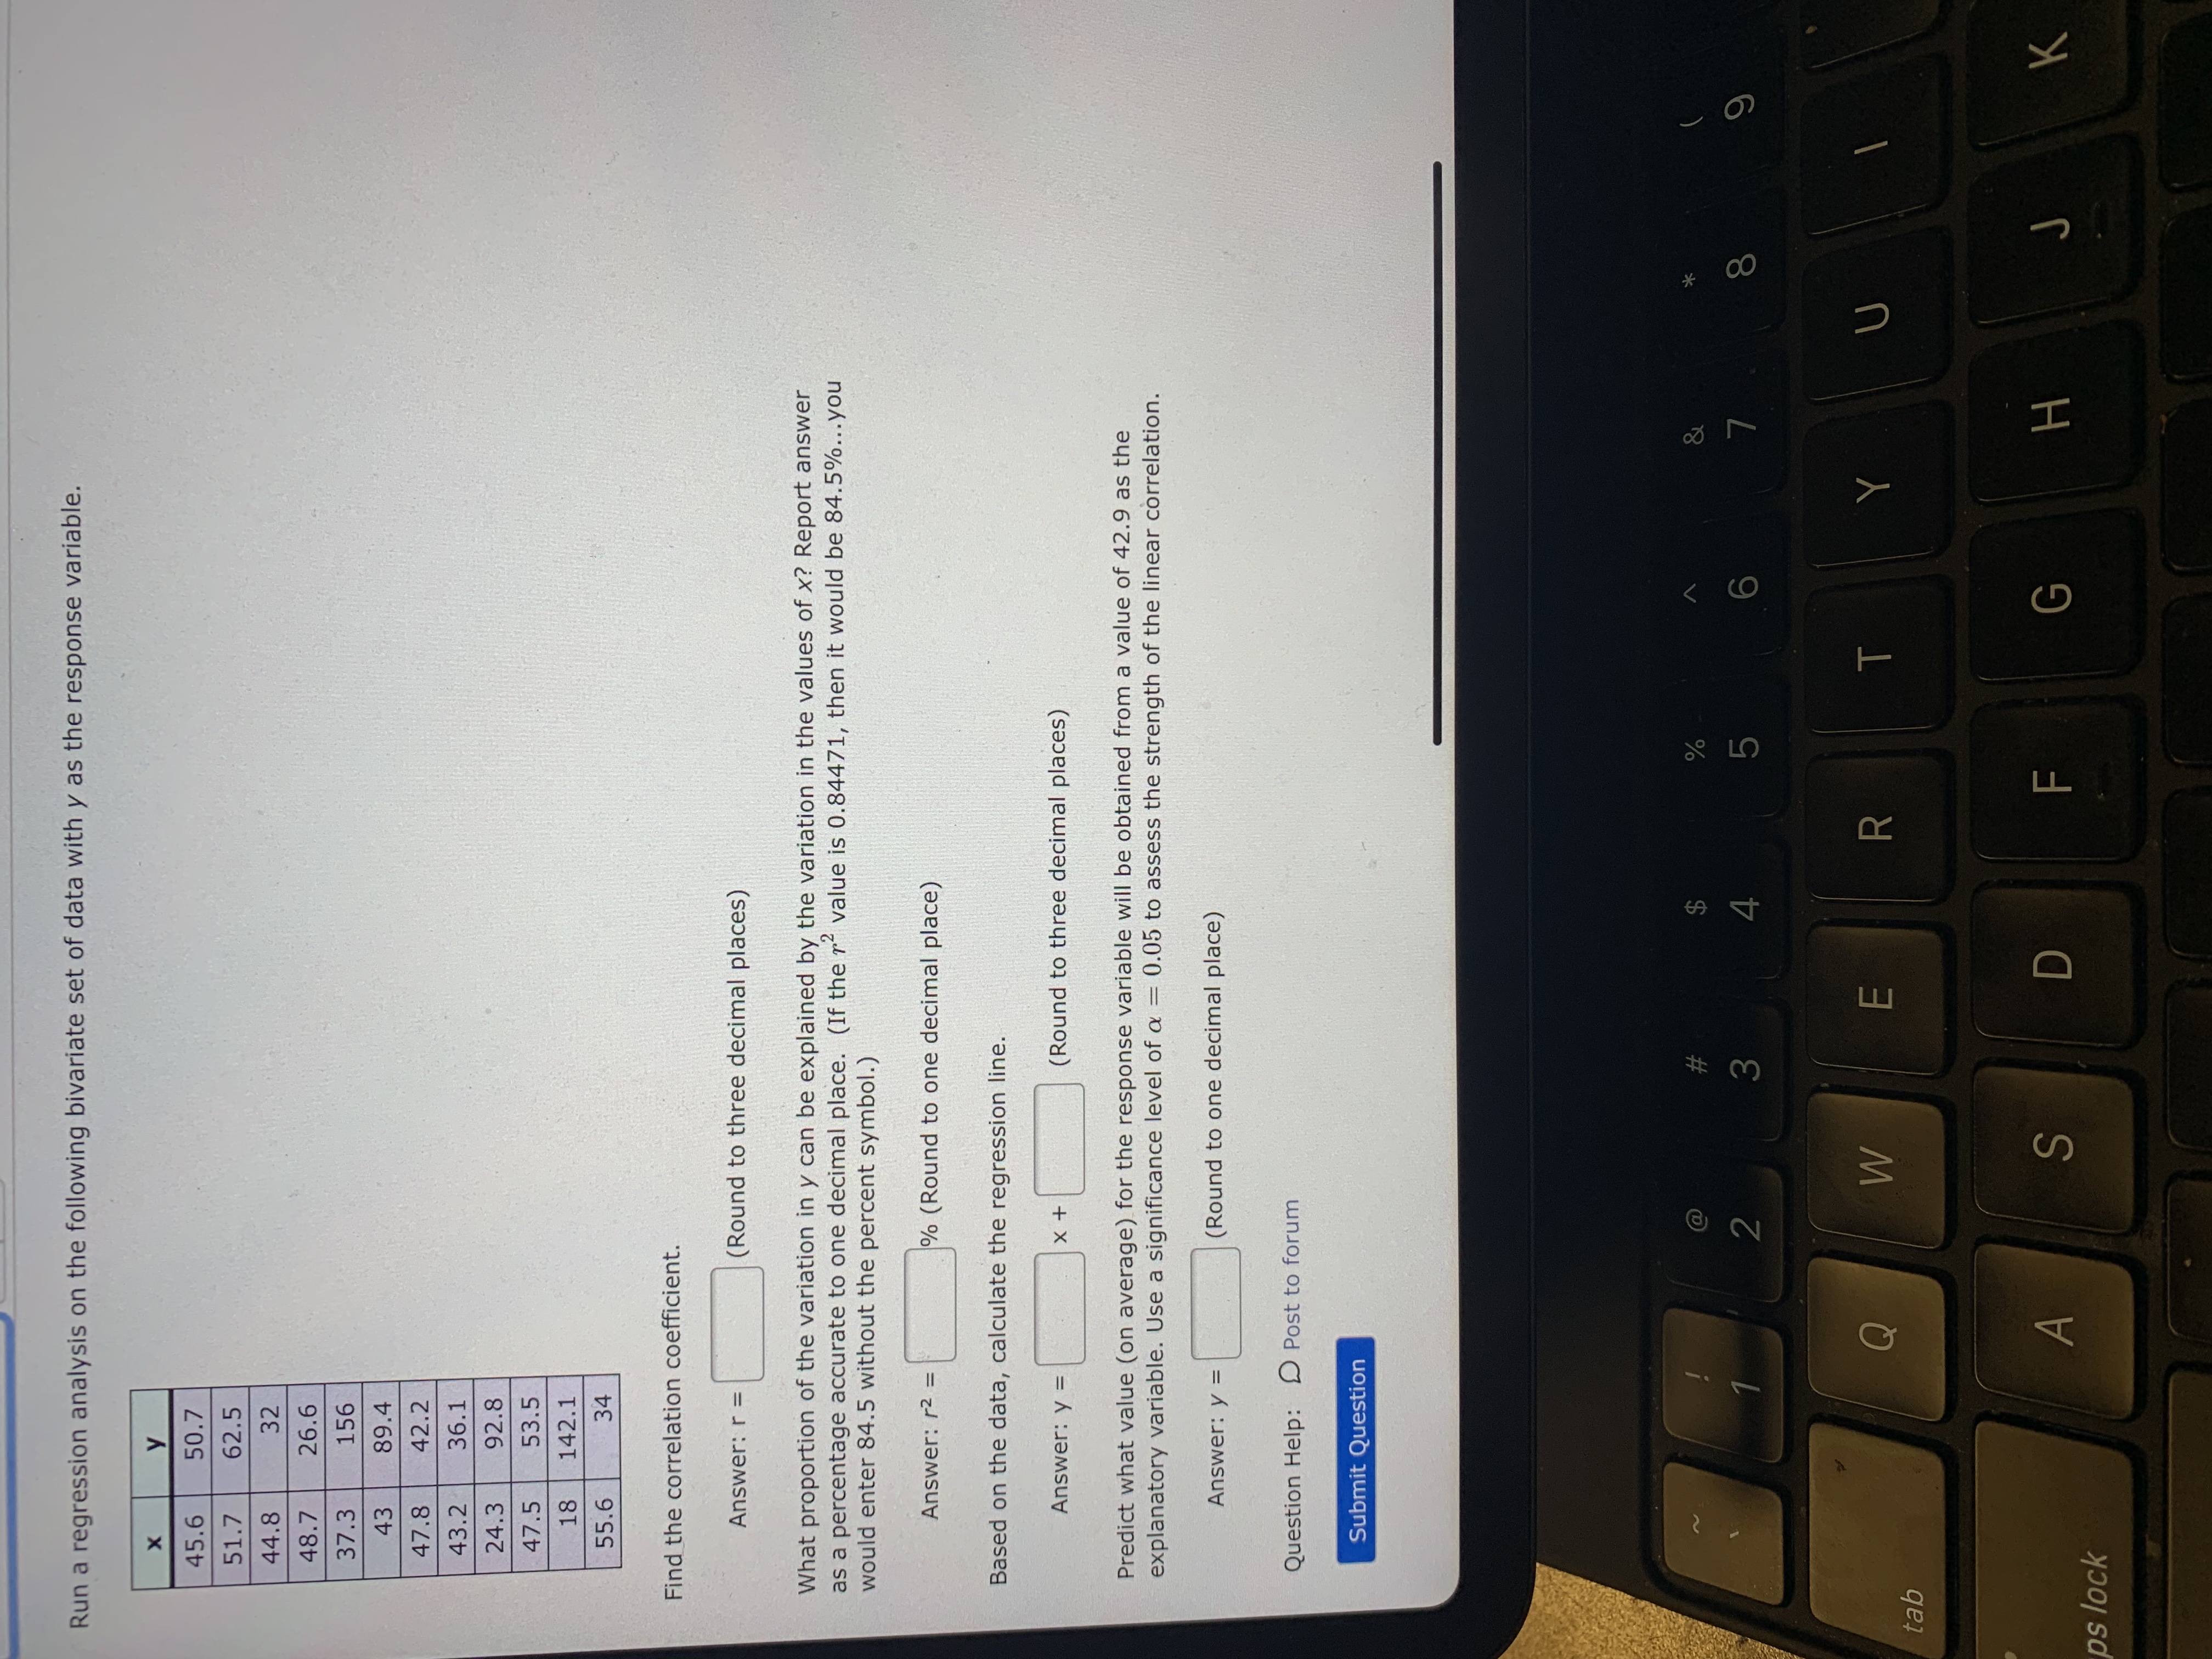
Run a regression analysis on the following bivariate set of data with y as the response variable. X 45.6 50.7 51.7 62.5 44.8 32 48.7 26.6 37.3 156 43 89.4 47.8 42.2 43.2 36.1 24 .3 92.8 47.5 53.5 18 142.1 55.6 34 Find the correlation coefficient. Answer: r = (Round to three decimal places) What proportion of the variation in y can be explained by the variation in the values of x? Report answer as a percentage accurate to one decimal place. (If the r value is 0.84471, then it would be 84.5%...you would enter 84.5 without the percent symbol.) Answer: 12 = (Round to one decimal place) Based on the data, calculate the regression line. Answer : y = x + (Round to three decimal places) Predict what value (on average) for the response variable will be obtained from a value of 42.9 as the explanatory variable. Use a significance level of a = 0.05 to assess the strength of the linear correlation. Answer: y = (Round to one decimal place) Question Help: Post to forum Submit Question a 2 A 8 Q W E R T Y U tab A S D F G H C K ps lock
Step by Step Solution
There are 3 Steps involved in it

Get step-by-step solutions from verified subject matter experts