

Question: pls I really need the answer urgently pls how can u help thanks PGI provided Wyler with financial statements for the last five years, which
pls I really need the answer urgently pls how can u help thanks
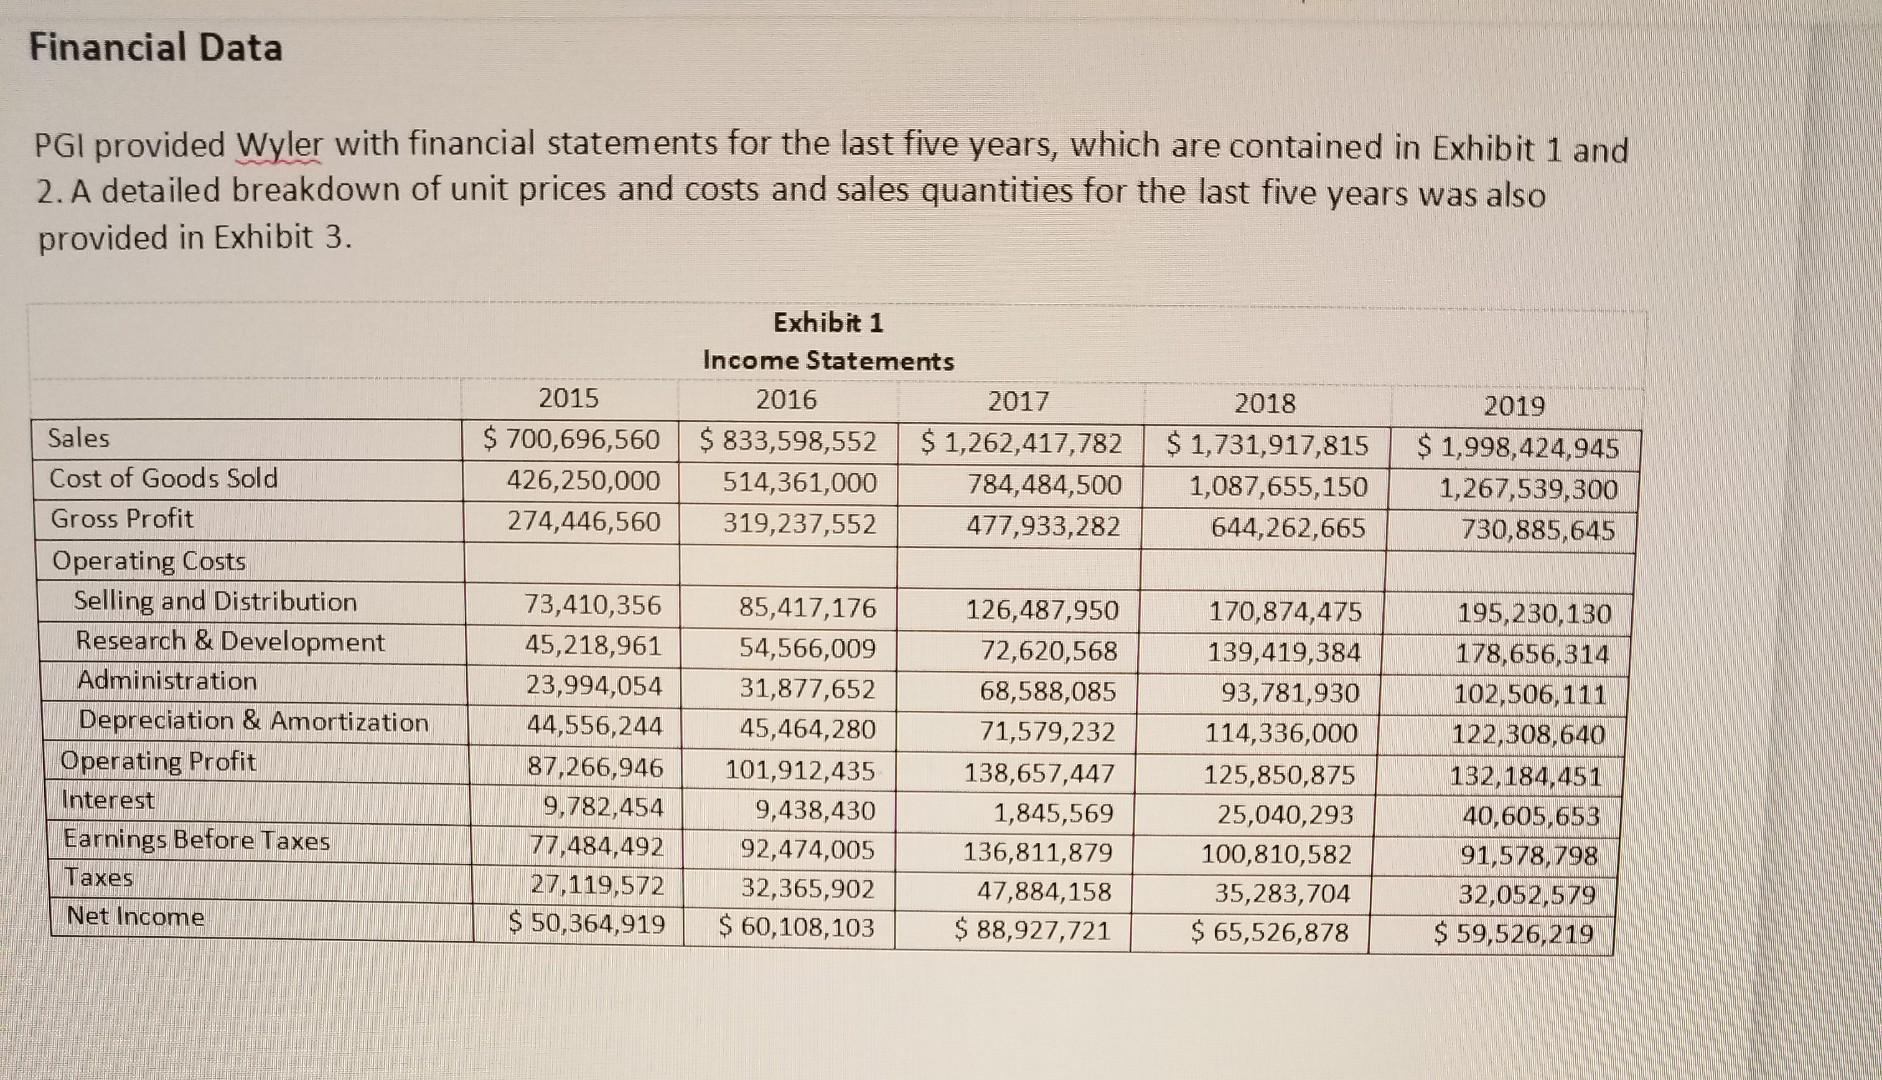
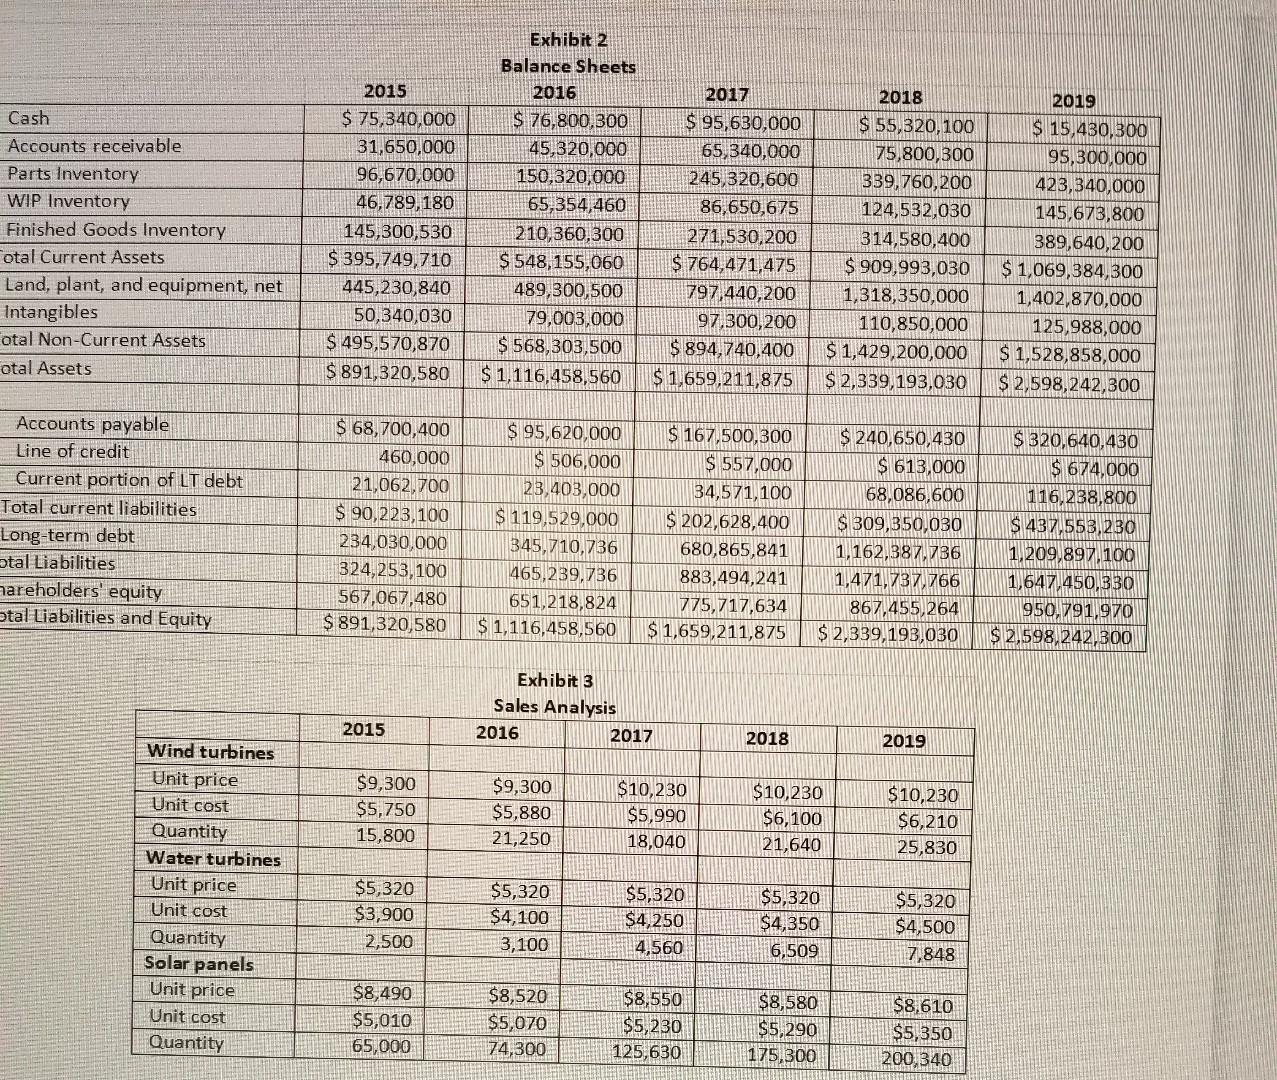
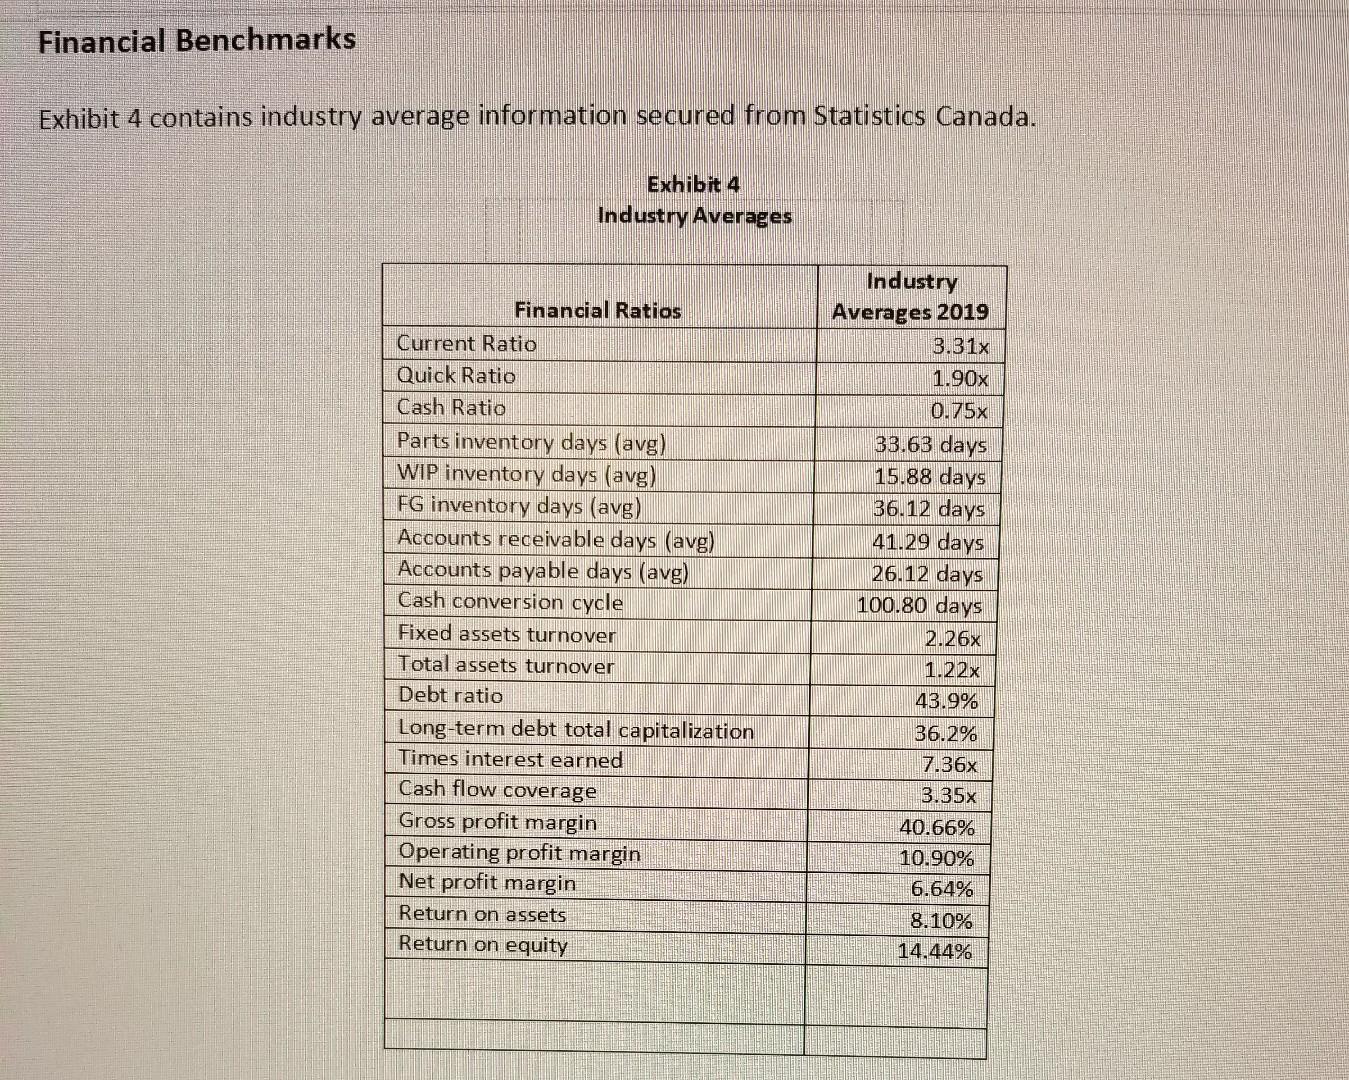
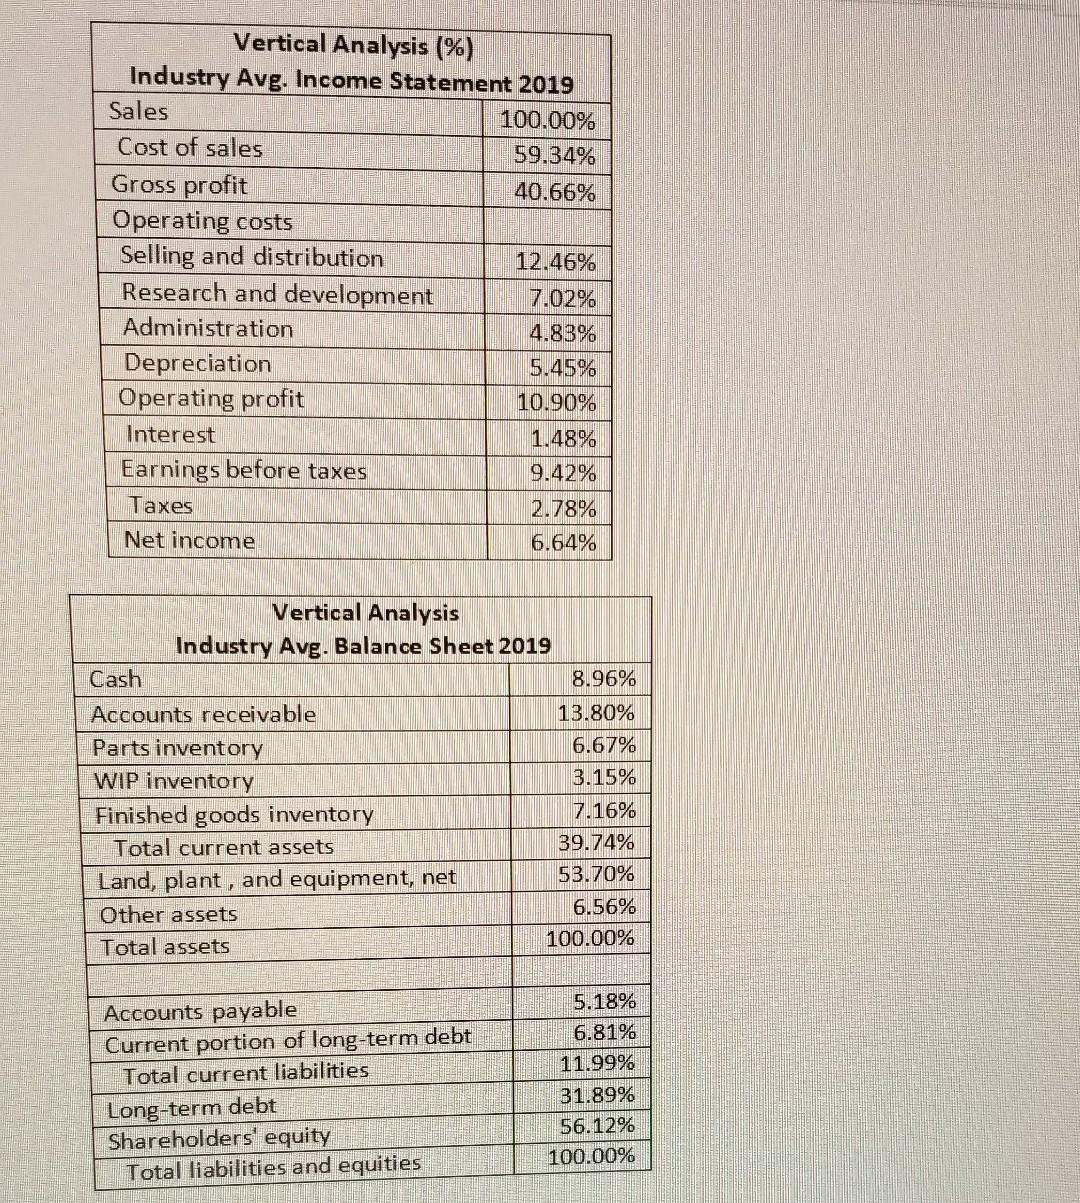
PGI provided Wyler with financial statements for the last five years, which are contained in Exhibit 1 and 2. A detailed breakdown of unit prices and costs and sales quantities for the last five years was also provided in Exhibit 3. Exhibit 2 Balance Sheets Exhibit 3 \begin{tabular}{|l|r|r|r|r|r|} \hline \multicolumn{1}{|c|}{ Sales Analysis } & & & \\ \hline Wind turbines & 2015 & 2016 & 2017 & 2018 & \\ \hline Unit price & & & & & \\ \hline Unit cost & $9,300 & $9,300 & $10,230 & $10,230 & $10,230 \\ \hline Quantity & $5,750 & $5,880 & $5,990 & $6,100 & $6,210 \\ \hline Water turbines & 15,800 & 21,250 & 18,040 & 21,640 & 25,830 \\ \hline Unit price & $5,320 & $5,320 & $5,320 & $5,320 & $5,320 \\ \hline Unit cost & $3,900 & $4,100 & $4,250 & $4,350 & $4,500 \\ \hline Quantity & 2,500 & 3,100 & 4,560 & 6,509 & 7,848 \\ \hline Solar panels & & & & & \\ \hline Unit price & $8,490 & $8,520 & $8,550 & $8,580 & $8,610 \\ \hline Unit cost & $5,010 & $5,070 & $5,230 & $5,290 & $5,350 \\ \hline Quantity & 65,000 & 74,300 & 125,630 & 175,300 & 200,340 \\ \hline \end{tabular} Financial Benchmarks Exhibit 4 contains industry average information secured from Statistics Canada. Exhibit 4 Industry Averages \begin{tabular}{|l|r|} \hline \multicolumn{2}{|c|}{ Vertical Analysis (\%) } \\ \hline Industry Avg. Income Statement 2019 \\ \hline Sales & 100.00% \\ \hline Cost of sales & 59.34% \\ \hline Gross profit & 40.66% \\ \hline Operating costs & \\ \hline Selling and distribution & 12.46% \\ \hline Research and development & 7.02% \\ \hline Administration & 4.83% \\ \hline Depreciation & 5.45% \\ \hline Operating profit & 10.90% \\ \hline Interest & 1.48% \\ \hline Earnings before taxes & 9.42% \\ \hline Taxes & 2.78% \\ \hline Net income & 6.64% \\ \hline \end{tabular} \begin{tabular}{|l|r|} \hline \multicolumn{2}{|c|}{ Vertical Analysis } \\ \hline \multicolumn{2}{|c|}{ Industry Avg. Balance Sheet 2019} \\ \hline Cash & 8.96% \\ \hline Accounts receivable & 13.80% \\ \hline Parts inventory & 6.67% \\ \hline WIP inventory & 3.15% \\ \hline Finished goods inventory & 7.16% \\ \hline Total current assets & 39.74% \\ \hline Land, plant, and equipment, net & 53.70% \\ \hline Other assets & 6.56% \\ \hline Total assets & 100.00% \\ \hline & \\ \hline Accounts payable & 5.18% \\ \hline Current portion of long-term debt & 6.81% \\ \hline Total current liabilities & 11.99% \\ \hline Long-term debt & 31.89% \\ \hline Shareholders' equity & 56.12% \\ \hline Total liabilities and equities & 100.00% \\ \hline \end{tabular} Prepare the following financial exhibits for 2015 through 2019: - Ratio table - Vertical analysis of income statements and balance sheets - Horizontal analysis (index numbers) of income statements and balance sheets - Cash flow statements - 5-part analysis of ROE
Step by Step Solution
There are 3 Steps involved in it

Get step-by-step solutions from verified subject matter experts