

Question: pls in python (include numpy library, matplotlib import image, and matplotlib import pyplot, and import numpy.linalg). using any image is fine instead of hendrix_final.png -
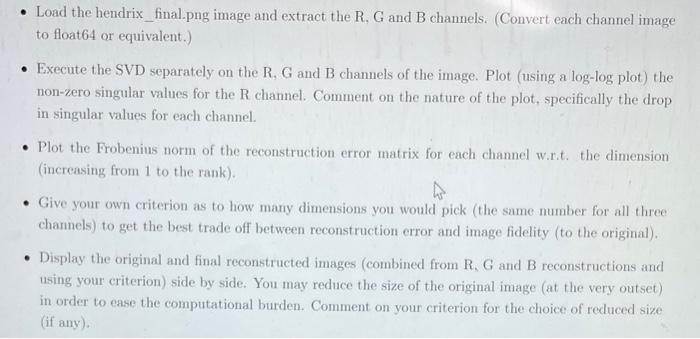
- Load the hendrix_final.png image and extract the R, G and B channels. (Convert each channel image to float64 or equivalent.) - Execute the SVD separately on the R, G and B channels of the image. Plot (using a log-log plot) the non-zero singular values for the R channel. Comment on the nature of the plot, specifically the drop in singular values for each channel. - Plot the Frobenius norm of the reconstruction error matrix for each channel w.r.t. the dimension (increasing from 1 to the rank). - Give your own criterion as to how many dimensions you would pick (the same number for all three chamnels) to get the best trade off between reconstruction error and image fidelity (to the original). - Display the original and final reconstructed images (combined from R, G and B reconstructions and using your criterion) side by side. You may reduce the size of the original image (at the very outset) in order to ease the computational burden. Comment on your criterion for the choice of reduced size (if any)
Step by Step Solution
There are 3 Steps involved in it

Get step-by-step solutions from verified subject matter experts