

Question: pls real answer not copy and pates Example 2 For the data in table generate the grid diagram Operation Cin Cout (ppm) (ppm) 1 2
pls real answer not copy and pates 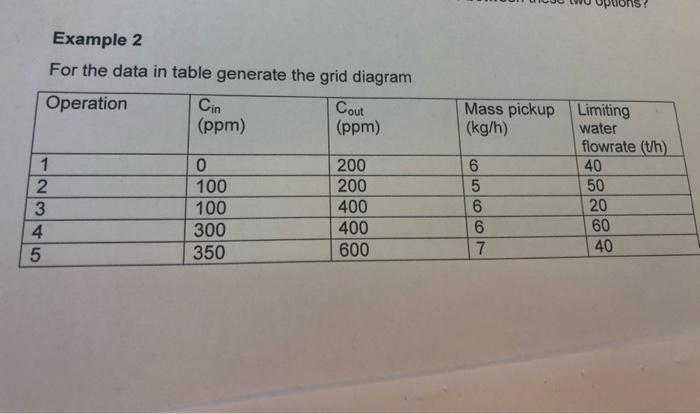
Example 2 For the data in table generate the grid diagram Operation Cin Cout (ppm) (ppm) 1 2 3 4 5 0 100 100 300 350 200 200 400 400 600 Mass pickup Limiting (kg/h) water flowrate (th) 6 40 5 50 6 20 6 60 7 40 Oo oo
Step by Step Solution
There are 3 Steps involved in it
1 Expert Approved Answer
Step: 1 Unlock

Question Has Been Solved by an Expert!
Get step-by-step solutions from verified subject matter experts
Step: 2 Unlock
Step: 3 Unlock