

Question: pls see attached The table to the right Workers per Age Group gives the number of (thousands) male and female 16-19 20-24 25+ Totals workers
pls see attached
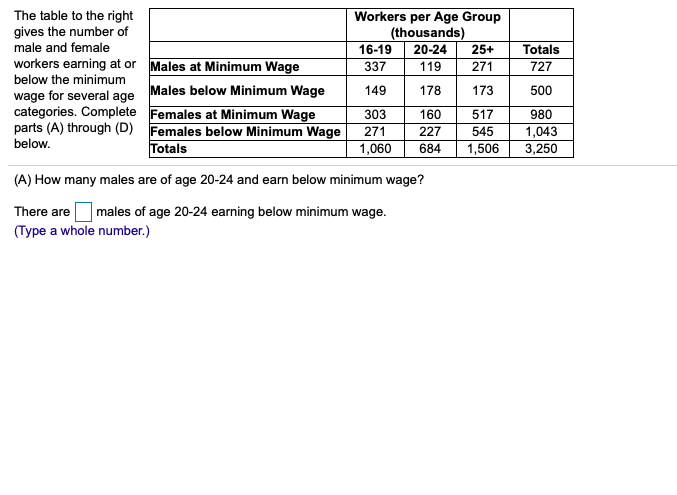
The table to the right Workers per Age Group gives the number of (thousands) male and female 16-19 20-24 25+ Totals workers earning at or Males at Minimum Wage 337 119 below the minimum 271 727 wage for several age Males below Minimum Wage 149 178 173 500 categories. Complete Females at Minimum Wage 303 160 517 980 parts (A) through (D) 271 227 below. Females below Minimum Wage 545 1,043 Totals 1,060 684 1,506 3,250 (A) How many males are of age 20-24 and earn below minimum wage? There are males of age 20-24 earning below minimum wage. (Type a whole number.)
Step by Step Solution
There are 3 Steps involved in it
1 Expert Approved Answer
Step: 1 Unlock

Question Has Been Solved by an Expert!
Get step-by-step solutions from verified subject matter experts
Step: 2 Unlock
Step: 3 Unlock