

Question: pls show work for thumbs up! maining Time: 2 hours, 50 minutes, 24 seconds. estion Completion Status QUESTION 31 25 points Save Answer Shown below
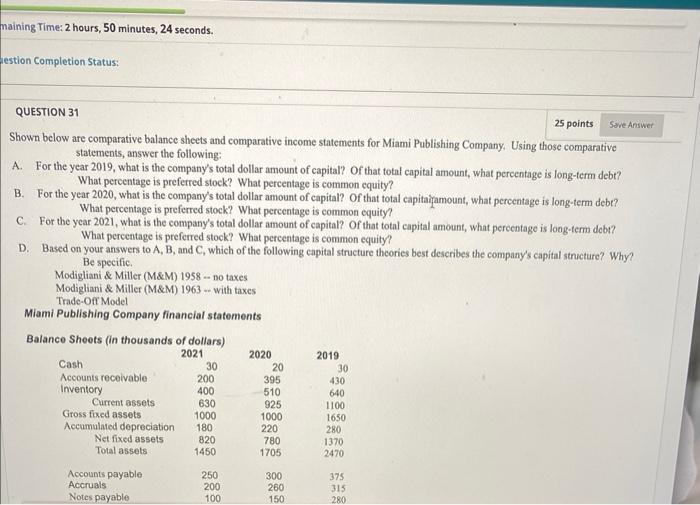
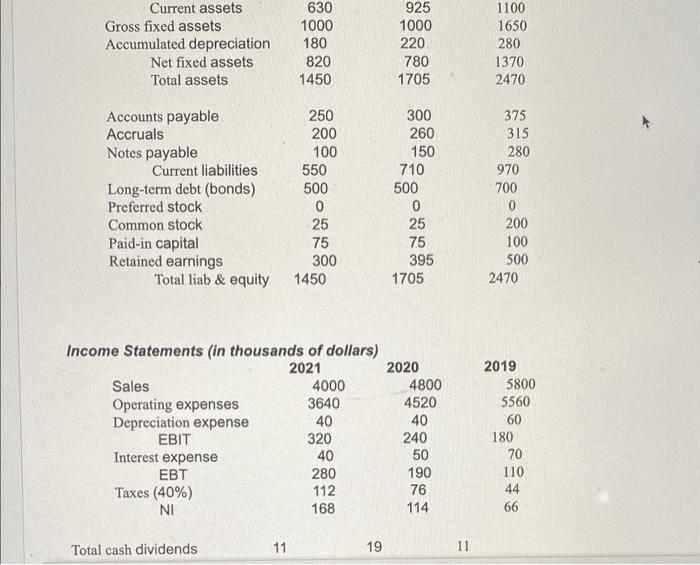
maining Time: 2 hours, 50 minutes, 24 seconds. estion Completion Status QUESTION 31 25 points Save Answer Shown below are comparative balance sheets and comparative income statements for Miami Publishing Company. Using those comparative statements, answer the following: A. For the year 2019, what is the company's total dollar amount of capital? Of that total capital amount, what percentage is long-term debt? What percentage is preferred stock? What percentage is common equity? B. For the year 2020, what is the company's total dollar amount of capital? Of that total capitaifamount, what percentage is long-term debt? What percentage is preferred stock? What percentage is common equity? C. For the year 2021, what is the company's total dollar amount of capital? Of that total capital amount, what percentage is long-term debt? What percentage is preferred stock? What percentage is common equity? D Based on your answers to A, B, and C, which of the following capital structure theories best describes the company's capital structure? Why? Be specific Modigliani & Miller (M&M) 1958 -- no taxes Modigliani & Miller (M&M) 1963 .. with taxes Trade-Off Model Miami Publishing Company financial statements Balance Sheets (in thousands of dollars) 2021 2020 2019 Cash 30 20 30 Accounts receivable 200 395 Inventory 400 510 640 Current assets 630 925 1100 Gross fixed assets 1000 1000 1650 Accumulated depreciation 180 220 280 Net fixed assets 820 780 1370 Total assets 1450 1705 2470 430 Accounts payable Accruals Notes payable 250 200 100 300 260 150 375 JIS 280 Current assets Gross fixed assets Accumulated depreciation Net fixed assets Total assets 630 1000 180 820 1450 925 1000 220 780 1705 1100 1650 280 1370 2470 Accounts payable Accruals Notes payable Current liabilities Long-term debt (bonds) Preferred stock Common stock Paid-in capital Retained earnings Total liab & equity 250 200 100 550 500 0 25 300 260 150 710 500 0 25 75 395 1705 375 315 280 970 700 0 200 100 500 2470 75 300 1450 Income Statements (in thousands of dollars) 2021 2020 Sales 4000 4800 Operating expenses 3640 4520 Depreciation expense 40 40 EBIT 320 240 Interest expense 40 50 EBT 280 190 Taxes (40%) 112 76 NI 168 114 2019 5800 5560 60 180 70 110 44 66 Total cash dividends 11 19 11 maining Time: 2 hours, 50 minutes, 24 seconds. estion Completion Status QUESTION 31 25 points Save Answer Shown below are comparative balance sheets and comparative income statements for Miami Publishing Company. Using those comparative statements, answer the following: A. For the year 2019, what is the company's total dollar amount of capital? Of that total capital amount, what percentage is long-term debt? What percentage is preferred stock? What percentage is common equity? B. For the year 2020, what is the company's total dollar amount of capital? Of that total capitaifamount, what percentage is long-term debt? What percentage is preferred stock? What percentage is common equity? C. For the year 2021, what is the company's total dollar amount of capital? Of that total capital amount, what percentage is long-term debt? What percentage is preferred stock? What percentage is common equity? D Based on your answers to A, B, and C, which of the following capital structure theories best describes the company's capital structure? Why? Be specific Modigliani & Miller (M&M) 1958 -- no taxes Modigliani & Miller (M&M) 1963 .. with taxes Trade-Off Model Miami Publishing Company financial statements Balance Sheets (in thousands of dollars) 2021 2020 2019 Cash 30 20 30 Accounts receivable 200 395 Inventory 400 510 640 Current assets 630 925 1100 Gross fixed assets 1000 1000 1650 Accumulated depreciation 180 220 280 Net fixed assets 820 780 1370 Total assets 1450 1705 2470 430 Accounts payable Accruals Notes payable 250 200 100 300 260 150 375 JIS 280 Current assets Gross fixed assets Accumulated depreciation Net fixed assets Total assets 630 1000 180 820 1450 925 1000 220 780 1705 1100 1650 280 1370 2470 Accounts payable Accruals Notes payable Current liabilities Long-term debt (bonds) Preferred stock Common stock Paid-in capital Retained earnings Total liab & equity 250 200 100 550 500 0 25 300 260 150 710 500 0 25 75 395 1705 375 315 280 970 700 0 200 100 500 2470 75 300 1450 Income Statements (in thousands of dollars) 2021 2020 Sales 4000 4800 Operating expenses 3640 4520 Depreciation expense 40 40 EBIT 320 240 Interest expense 40 50 EBT 280 190 Taxes (40%) 112 76 NI 168 114 2019 5800 5560 60 180 70 110 44 66 Total cash dividends 11 19 11
Step by Step Solution
There are 3 Steps involved in it

Get step-by-step solutions from verified subject matter experts