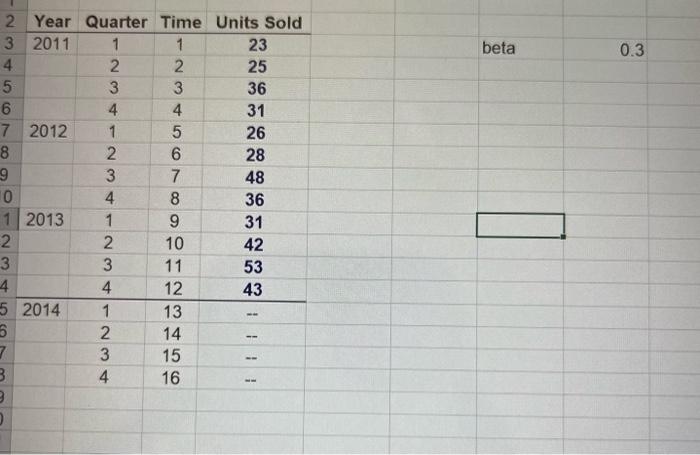
Question: pls show work & formulas on excel 3. Stationary data with additive seasonal effects. (Please review spreadsheet model of Forecast 3.xlsx.) You are given the

pls show work & formulas on excel
pls show work & formulas on excel 3. Stationary
3. Stationary data with additive seasonal effects. (Please review spreadsheet model of Forecast 3.xlsx.) You are given the quarterly data on the number of four-wheel drive, sport utility vehicles sold by a local car dealer during the past three years (See 3rd worksheet in Assignment 2.xlsx). Answer the following questions, a) Use the additive seasonal technique for stationary data to model the data. Use Solver to determine the optimal values of a and B. (10 pts) 23 beta 0.3 AN 2 Year Quarter Time Units Sold 3 2011 1 1 4 2 2 25 5 3 3 36 6 4 4 31 7 2012 1 5 26 8 2 6 28 9 3 7 48 0 4 8 36 1 2013 1 9 31 2 2. 10 42 3 3 11 4 4 12 43 5 2014 1 13 5 2 14 7 3 15 3 4 16 53 AN b) What is the optimal value of a and B. (10 pts) c) What are the forecasts for each quarter in 2014 using this technique? (5 pts)

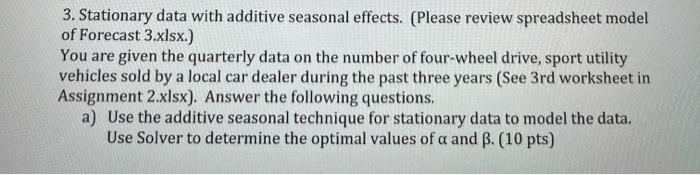
Step by Step Solution

There are 3 Steps involved in it

1 Expert Approved Answer
Step: 1 Unlock blur-text-image
Question Has Been Solved by an Expert!

Get step-by-step solutions from verified subject matter experts

Step: 2 Unlock
Step: 3 Unlock

Students Have Also Explored These Related General Management Questions!