

Question: PLS SOLVE CORRECTLY; show all answers. Comparative financial statement data for Orole Company and Blossom Company, two competitors, appear below. All balance sheet data areas
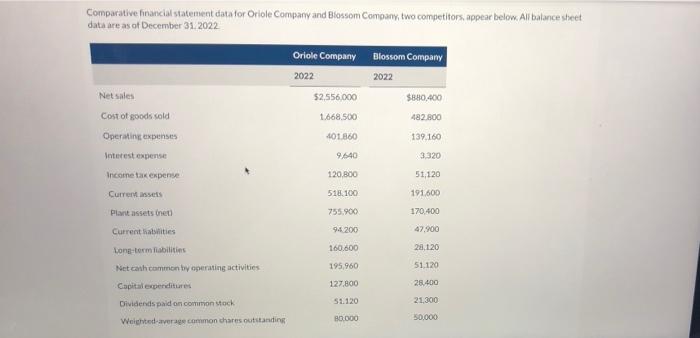
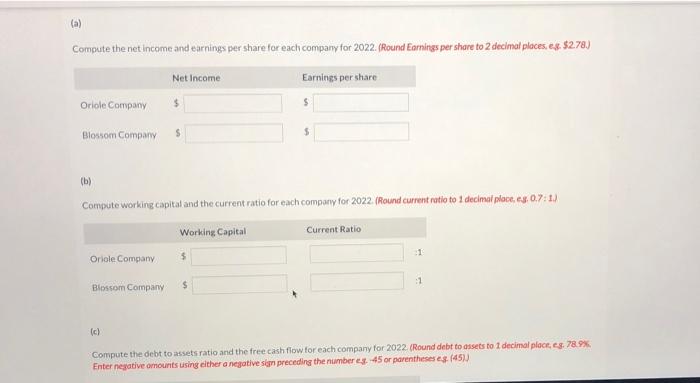
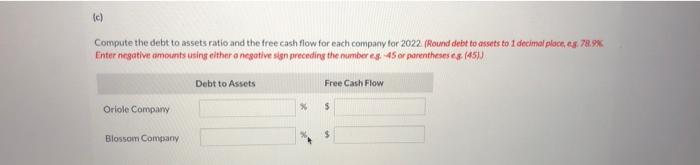
Comparative financial statement data for Orole Company and Blossom Company, two competitors, appear below. All balance sheet data areas of December 31, 2022 Oriole Company Blossom Company 2022 2022 Net sales 52.556,000 $880,400 482.800 1.668.500 Cost of goods sold Operating expenses Interest expense 401.860 139.160 9,640 3.320 Income tax expense 120.800 51,120 Current sets 518.100 191.600 Plant assets net 755.900 170.400 Currentlasties 94200 47.900 28.120 160.600 195,960 Long-term fiabilities Net canh common by operating activities Capital experiditures Dividends paid on common stock Weighted average common chare outstanding 51,120 28.400 127.800 51.120 21.300 B0.000 50.000 (a) Compute the net income and earnings per share for each company for 2022. (Round Earnings per share to 2 decimal places, ex $278.) Net Income Earnings per share Oriole Company $ $ Blossom Company $ (6) Compute working capital and the current ratio for each company for 2022. Round current ratio to 1 decimal place, as 07:1) Working Capital Current Ratio 31 Oriole Company $ :1 Blossom Company $ (c) Compute the debt to assets ratio and the free cash flow for each company for 2022 (Round debt to assets to I decimal place, 9.78.9% Enter negative amounts using either a negative sin preceding the number 45 or parentheses es (451) (c) Compute the debt to assets ratio and the free cash flow for each company for 2022 (Round debt to assets to 1 decimal place, as 78.9% Enter negative amounts using either a negative sin preceding the number es. 45 or parentheses es (451) Debt to Assets Free Cash Flow Oriole Company X $ $ Blossom Company
Step by Step Solution
There are 3 Steps involved in it

Get step-by-step solutions from verified subject matter experts