

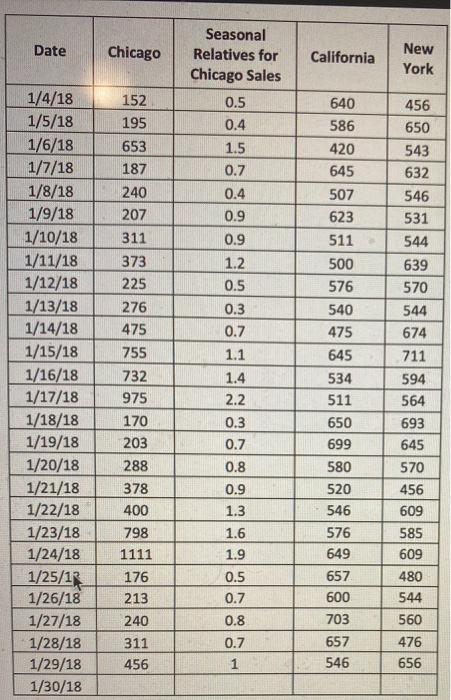
Question: pls use excel Question Set 2. Using only the California sales data: 1. Forecast sales for January 7th through January 30th using a three-day weighted
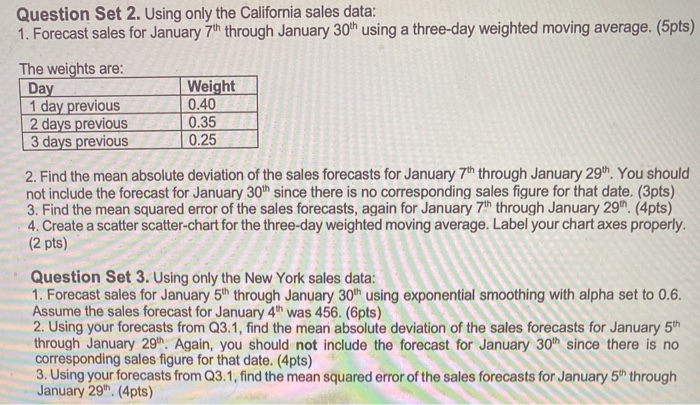
pls use excel
Step by Step Solution
There are 3 Steps involved in it
1 Expert Approved Answer
Step: 1 Unlock

Question Has Been Solved by an Expert!
Get step-by-step solutions from verified subject matter experts
Step: 2 Unlock
Step: 3 Unlock