

Question: plz answer only e,f,g thx 7. The table below provides the number of hours spent studying and math grade data for the students in data
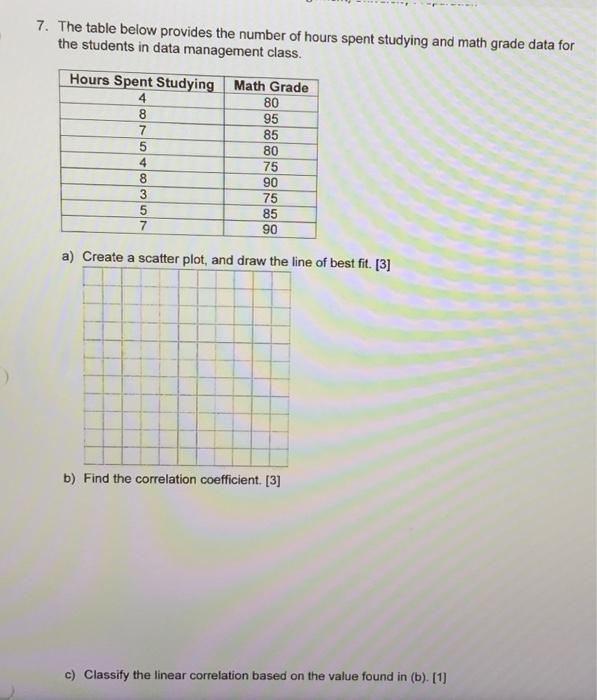
7. The table below provides the number of hours spent studying and math grade data for the students in data management class. Hours Spent Studying Math Grade 4 80 8 95 7 85 5 80 4 75 8 90 3 75 5 85 7 90 a) Create a scatter plot, and draw the line of best fit. [3] b) Find the correlation coefficient. [3] c) Classify the linear correlation based on the value found in (b). [1] d) Use linear regression to determine the equation of the line of best fit. [4] e) What grade is predicted for a student who studied 6 hours? [1] f) Based on this survey, how long must a student study to achieve a grade of 957 [1] g) What type of causal relationship is present in this situation? Justify your answer. [3]
Step by Step Solution
There are 3 Steps involved in it

Get step-by-step solutions from verified subject matter experts