Question: PLZ attach the excel file. IMSE 421 Homework 12 BACKGROUND You are a stock day trader and investing in four stocks (A, B, C, and
PLZ attach the excel file.
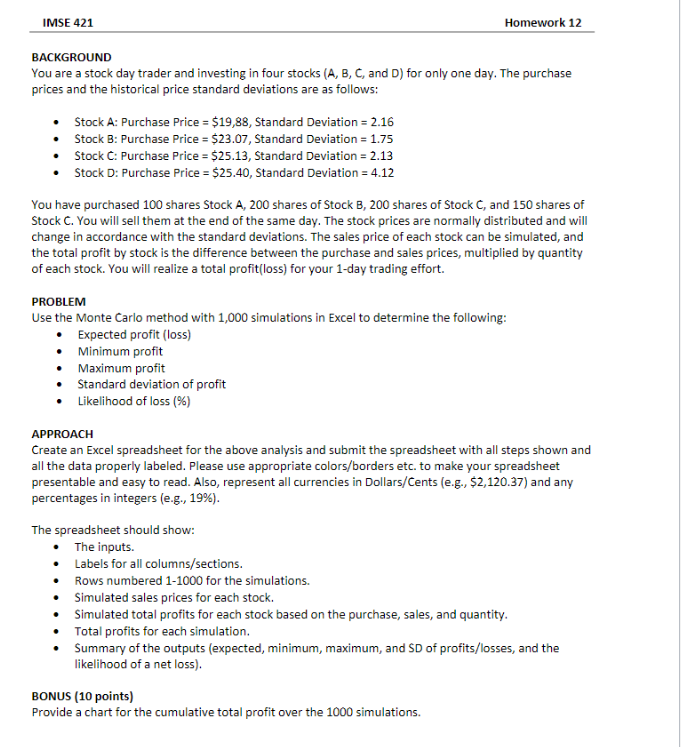
IMSE 421 Homework 12 BACKGROUND You are a stock day trader and investing in four stocks (A, B, C, and D) for only one day. The purchase prices and the historical price standard deviations are as follows: Stock A: Purchase Price = $19,88, Standard Deviation = 2.16 Stock B: Purchase Price = $23.07, Standard Deviation = 1.75 Stock C: Purchase Price = $25.13, Standard Deviation = 2.13 Stock D: Purchase Price = $25.40, Standard Deviation = 4.12 You have purchased 100 shares Stock A, 200 shares of Stock B, 200 shares of Stock C, and 150 shares of Stock C. You will sell them at the end of the same day. The stock prices are normally distributed and will change in accordance with the standard deviations. The sales price of each stock can be simulated, and the total profit by stock is the difference between the purchase and sales prices, multiplied by quantity of each stock. You will realize a total profit(loss) for your 1-day trading effort. PROBLEM Use the Monte Carlo method with 1,000 simulations in Excel to determine the following: Expected profit (loss) Minimum profit . . . Maximum profit Standard deviation of profit Likelihood of loss (%) APPROACH Create an Excel spreadsheet for the above analysis and submit the spreadsheet with all steps shown and all the data properly labeled. Please use appropriate colors/borders etc. to make your spreadsheet presentable and easy to read. Also, represent all currencies in Dollars/Cents (e.g., $2,120.37) and any percentages in integers (e.g., 19%). The spreadsheet should show: The inputs. Labels for all columns/sections. Rows numbered 1-1000 for the simulations. Simulated sales prices for each stock. Simulated total profits for each stock based on the purchase, sales, and quantity. Total profits for each simulation. Summary of the outputs (expected, minimum, maximum, and SD of profits/losses, and the likelihood of a net loss). BONUS (10 points) Provide a chart for the cumulative total profit over the 1000 simulations
Step by Step Solution
There are 3 Steps involved in it
1 Expert Approved Answer
Step: 1 Unlock
Question Has Been Solved by an Expert!
Get step-by-step solutions from verified subject matter experts
Step: 2 Unlock
Step: 3 Unlock
Students Have Also Explored These Related Finance Questions!