

Question: plz explain as much as you can 1. Prepare the following ratios for Mike's Manufacturing for 2014, 2015, 2016, & 2017: ii) iv) Current Ratio
plz explain as much as you can
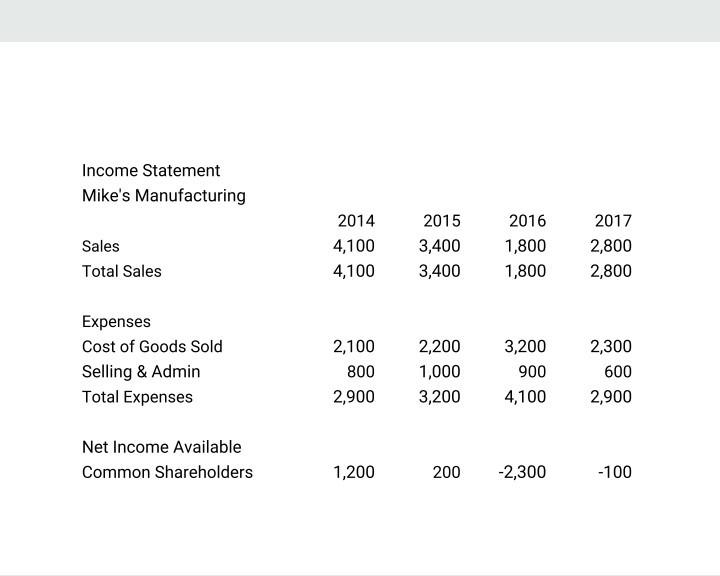
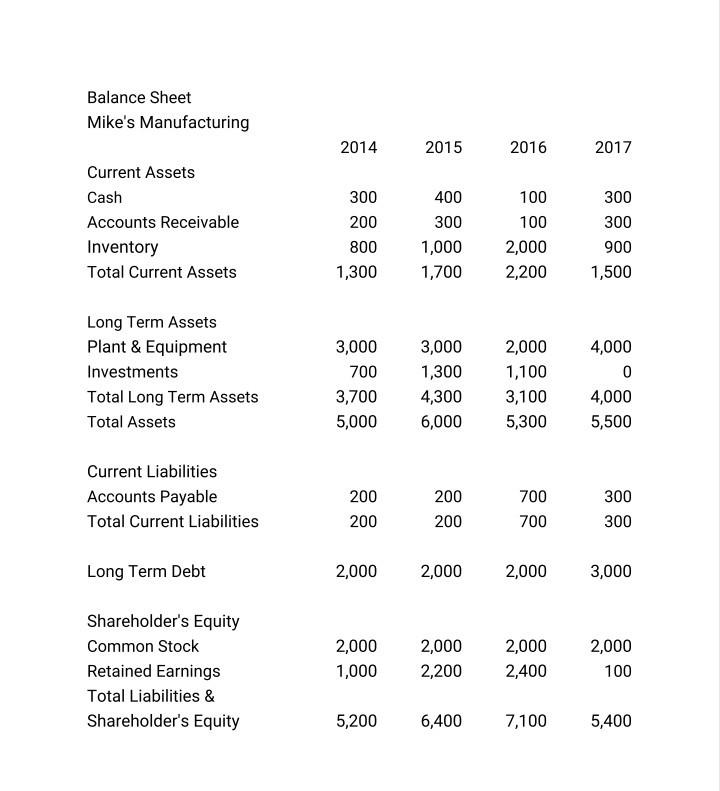
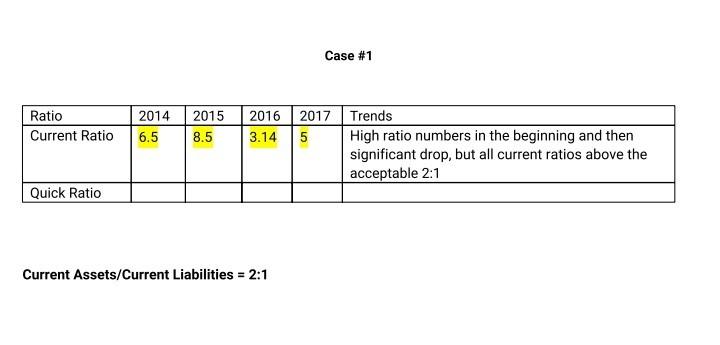
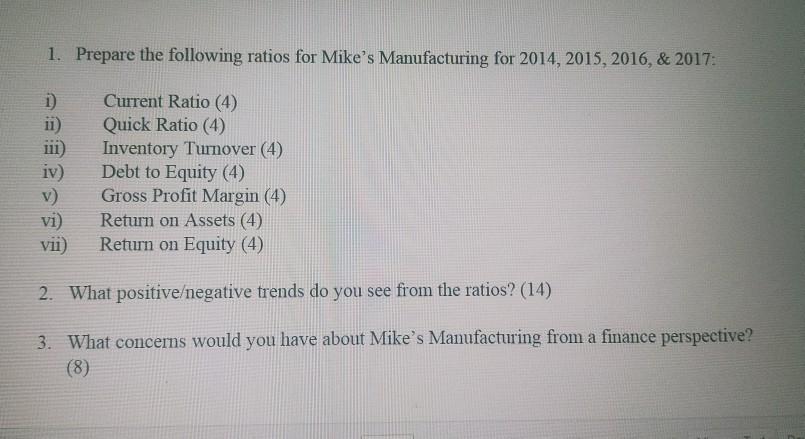
1. Prepare the following ratios for Mike's Manufacturing for 2014, 2015, 2016, & 2017: ii) iv) Current Ratio (4) Quick Ratio (4) Inventory Turnover (4) Debt to Equity (4) Gross Profit Margin (4) Return on Assets (4) Return on Equity (4) vi) vii) 2. What positiveegative trends do you see from the ratios? (14) 3. What concerns would you have about Mike's Manufacturing from a finance perspective? (8) Income Statement Mike's Manufacturing Sales Total Sales 2014 4,100 4,100 2015 3,400 3,400 2016 1,800 1,800 2017 2,800 2,800 2,300 Expenses Cost of Goods Sold Selling & Admin Total Expenses 2,100 800 2,900 2,200 1,000 3,200 3,200 900 4,100 600 2,900 Net Income Available Common Shareholders 1,200 200 -2,300 -100 Balance Sheet Mike's Manufacturing 2014 2015 2016 2017 Current Assets Cash Accounts Receivable Inventory Total Current Assets 300 200 800 1,300 400 300 1,000 1,700 100 100 2,000 2,200 300 300 900 1,500 Long Term Assets Plant & Equipment Investments Total Long Term Assets Total Assets 3,000 700 3,700 5,000 3,000 1,300 4,300 6,000 2,000 1,100 3,100 5,300 4,000 0 4,000 5,500 Current Liabilities Accounts Payable Total Current Liabilities 200 200 200 200 700 700 300 300 Long Term Debt 2,000 2,000 2,000 3,000 Shareholder's Equity Common Stock Retained Earnings Total Liabilities & Shareholder's Equity 2,000 1,000 2,000 2,200 2,000 2,400 2,000 100 5,200 6,400 7,100 5,400 Case #1 Ratio Current Ratio 2014 6.5 2015 8.5 2016 2017 Trends 3.14 5 High ratio numbers in the beginning and then significant drop, but all current ratios above the acceptable 2:1 Quick Ratio Current Assets/Current Liabilities = 2:1
Step by Step Solution
There are 3 Steps involved in it

Get step-by-step solutions from verified subject matter experts