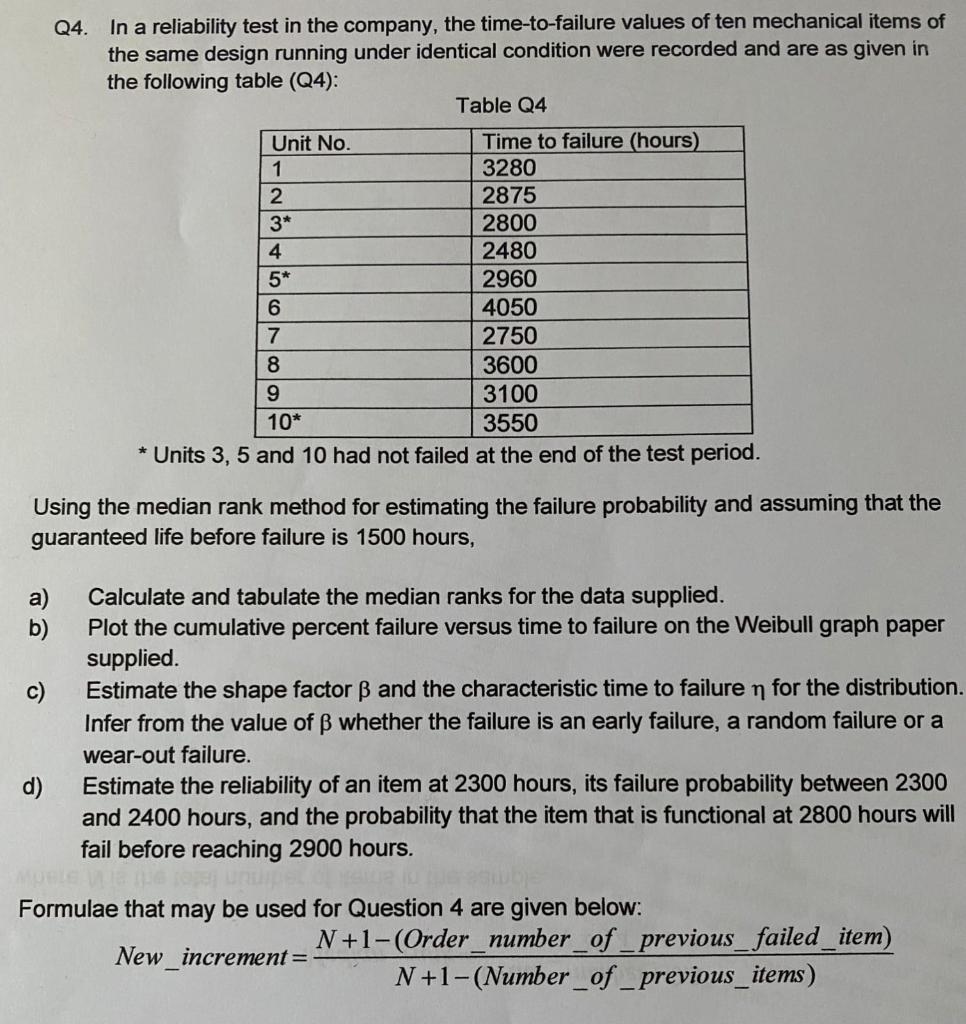
Question: Plz explain each step Q4. In a reliability test in the company, the time-to-failure values of ten mechanical items of the same design running under

Plz explain each step Q4. In a reliability testPlz explain each step

Q4. In a reliability test in the company, the time-to-failure values of ten mechanical items of the same design running under identical condition were recorded and are as given in the following table (Q4): Table Q4 Unit No. Time to failure (hours) 1 3280 2 2875 3* 2800 4 2480 5* 2960 6 4050 7 2750 8 3600 9 3100 10* 3550 * Units 3, 5 and 10 had not failed at the end of the test period. Using the median rank method for estimating the failure probability and assuming that the guaranteed life before failure is 1500 hours, a) b) c) Calculate and tabulate the median ranks for the data supplied. Plot the cumulative percent failure versus time to failure on the Weibull graph paper supplied. Estimate the shape factor B and the characteristic time to failure n for the distribution. Infer from the value of whether the failure is an early failure, a random failure or a wear-out failure. Estimate the reliability of an item at 2300 hours, its failure probability between 2300 and 2400 hours, and the probability that the item that is functional at 2800 hours will fail before reaching 2900 hours. d) Formulae that may be used for Question 4 are given below: N +1-(Order_number_of_previous_failed_item) New_increment= N+1-(Number_of_previous_items) Q4. In a reliability test in the company, the time-to-failure values of ten mechanical items of the same design running under identical condition were recorded and are as given in the following table (Q4): Table Q4 Unit No. Time to failure (hours) 1 3280 2 2875 3* 2800 4 2480 5* 2960 6 4050 7 2750 8 3600 9 3100 10* 3550 * Units 3, 5 and 10 had not failed at the end of the test period. Using the median rank method for estimating the failure probability and assuming that the guaranteed life before failure is 1500 hours, a) b) c) Calculate and tabulate the median ranks for the data supplied. Plot the cumulative percent failure versus time to failure on the Weibull graph paper supplied. Estimate the shape factor B and the characteristic time to failure n for the distribution. Infer from the value of whether the failure is an early failure, a random failure or a wear-out failure. Estimate the reliability of an item at 2300 hours, its failure probability between 2300 and 2400 hours, and the probability that the item that is functional at 2800 hours will fail before reaching 2900 hours. d) Formulae that may be used for Question 4 are given below: N +1-(Order_number_of_previous_failed_item) New_increment= N+1-(Number_of_previous_items)

Step by Step Solution

There are 3 Steps involved in it

1 Expert Approved Answer
Step: 1 Unlock blur-text-image
Question Has Been Solved by an Expert!

Get step-by-step solutions from verified subject matter experts

Step: 2 Unlock
Step: 3 Unlock

Students Have Also Explored These Related General Management Questions!