

Question: Plz help Energy For this assignment you will use Excel (or similar graphing software) to create a data table and graph. The first 4 minutes
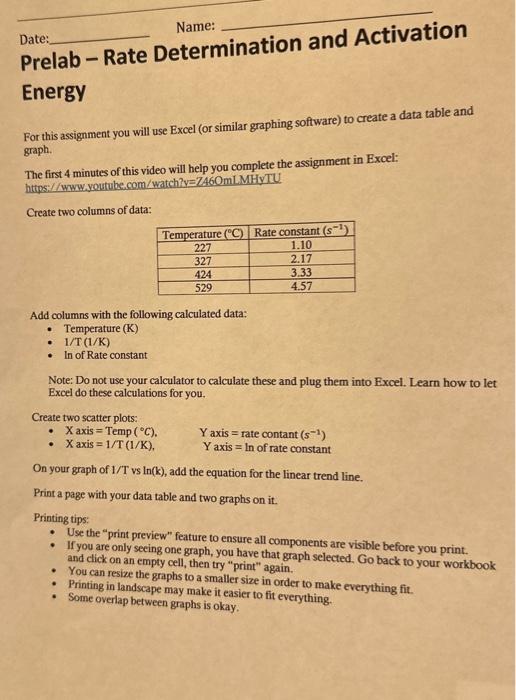
Energy For this assignment you will use Excel (or similar graphing software) to create a data table and graph. The first 4 minutes of this video will help you complete the assignment in Excel: httips:/ www youtube com/watch? y=7460mLMHyTU Create two columns of data: Add columns with the following calculated data: - Temperature (K) - 1/T(1/K) - In of Rate constant Note: Do not use your calculator to calculate these and plug them into Fixcel. Learn how to let Excel do these calculations for you. Create two scatter plots: - X axis =Temp(C). Y axis = rate contant (s1) - X axis =1/T(1/K). Y axis =ln of rate constant On your graph of 1/T vs ln(k), add the equation for the linear trend line. Print a page with your data table and two graphs on it. Printing tips: - Use the "print preview" feature to ensure all components are visible before you print. - If you are only secing one graph, you have that graph selected. Go back to your workbook and click on an empty cell, then try "print" again. - You can resize the graphs to a smaller size in order to make everything fit. - Printing in landscape may make it easier to fit everything. - Some overlap between graphs is okay
Step by Step Solution
There are 3 Steps involved in it

Get step-by-step solutions from verified subject matter experts