

Question: plz help Required information Problem 17-2A (Algo) Ratios, common-size statements, and trend percents LO P1, P2, P3 The following information applies to the questions displayed
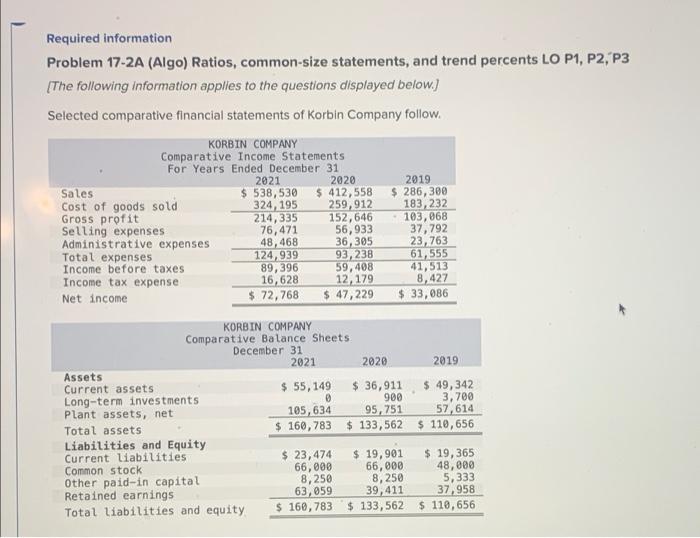
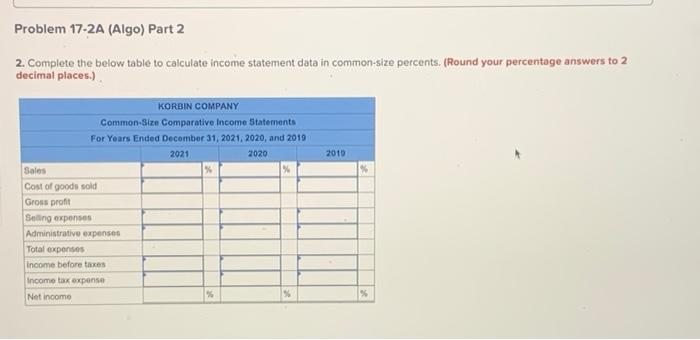
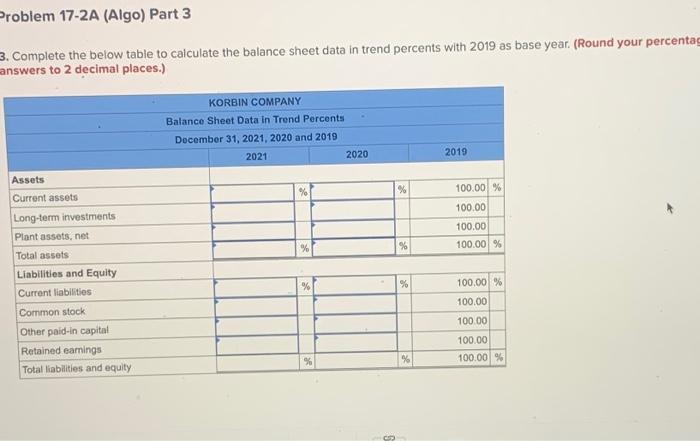
Required information Problem 17-2A (Algo) Ratios, common-size statements, and trend percents LO P1, P2, P3 The following information applies to the questions displayed below.) Selected comparative financial statements of Korbin Company follow. KORBIN COMPANY Comparative Income Statements For Years Ended December 31 2021 2020 2019 Sales $ 538,530 $ 412,558 $ 286,300 Cost of goods sold 324, 195 259,912 183,232 Gross profit 214,335 152,646 103,068 Selling expenses 76,471 56,933 37,792 Administrative expenses 48,468 36,305 23,763 Total expenses 124,939 93,238 61,555 Income before taxes 89, 396 59,408 41,513 Income tax expense 16,628 12,179 8,427 Net income $ 72,768 $ 47,229 $ 33,086 KORBIN COMPANY Comparative Balance Sheets December 31 2021 2020 Assets Current assets $ 55,149 $ 36,911 Long-term investments 0 900 Plant assets, net 105, 634 95,751 Total assets $ 160,783 $ 133,562 Liabilities and Equity Current liabilities $ 23,474 $ 19,901 Common stock 66,000 66,000 Other paid-in capital 8,250 8,250 Retained earnings 63,059 39,411 Total liabilities and equity $ 160, 783 $ 133,562 2019 $ 49,342 3,700 57,614 $ 110,656 $ 19,365 48,000 5,333 37,958 $ 110,656 Problem 17-2A (Algo) Part 2 2. Complete the below table to calculate income statement data in common-size percents. (Round your percentage answers to 2 decimal places.) 2010 KORBIN COMPANY Common Size Comparative Income Statements For Years Ended December 31, 2021, 2020, and 2019 2021 2020 Sales % Cost of goods sold Gross profit Selling expenses Administrative expenses Total expenses Income before tres Income tax expense Net Income % Problem 17-2A (Algo) Part 3 3. Complete the below table to calculate the balance sheet data in trend percents with 2019 as base year. (Round your percentag answers to 2 decimal places.) KORBIN COMPANY Balance Sheet Data In Trend Percents December 31, 2021, 2020 and 2019 2021 2020 2019 % % 100.00 % 100.00 100.00 100.00 % % % % Assets Current assets Long-term investments Plant assets, net Total assets Liabilities and Equity Current liabilities Common stock Other paid-in capital Retained earnings Total liabilities and equity % % 100,00 % 100,00 100.00 100.00 100.00 % %
Step by Step Solution
There are 3 Steps involved in it

Get step-by-step solutions from verified subject matter experts