

Question: plz help with this statistics problem with clear steps 1. The distribution of the number of vacation days per year offered by different U.S. companies
plz help with this statistics problem with clear steps
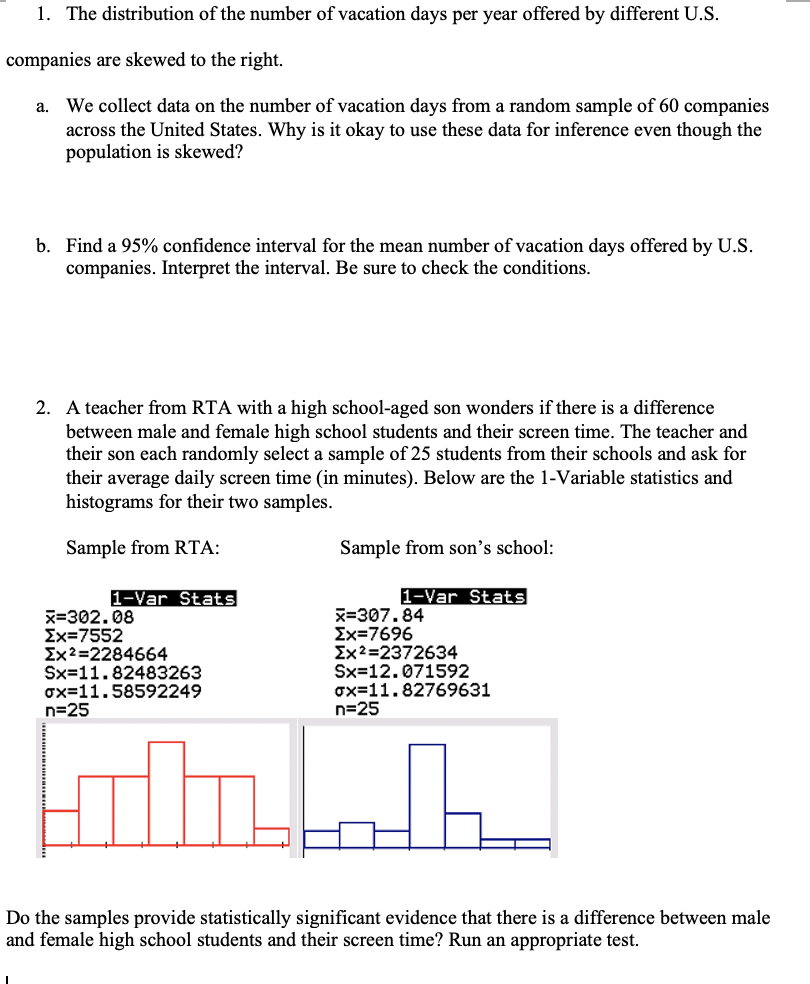
1. The distribution of the number of vacation days per year offered by different U.S. companies are skewed to the right. a. We collect data on the number of vacation days from a random sample of 60 companies across the United States. Why is it okay to use these data for inference even though the population is skewed? b. Find a 95% condence interval for the mean number of vacation days offered by U.S. companies. Interpret the interval. Be sure to check the conditions. 2. A teacher from RTA with a high school-aged son wonders if there is a difference between male and female high school students and their screen time. The teacher and their son each randomly select a sample of 25 students from their schools and ask for their average daily screen time (in minutes). Below are the l-Variable statistics and histograms for their two samples. Sample from RTA: Sample from son's school: i=302. 08 2357552 Ext-2284664 Ix3=2372634 Sx=11 . 82483263 5x=12. 071592 ox=11 . 58592249 ox=11 . 82769631 _n=25 n=25 Do the samples provide statistically signicant evidence that there is a difference between male and female high school students and their screen time? Run an appropriate test
Step by Step Solution
There are 3 Steps involved in it

Get step-by-step solutions from verified subject matter experts