

Question: Plz show Matlab code and graph plz answer question at end too 4. Make a m-file and write MATLAB commands in it to accomplish the
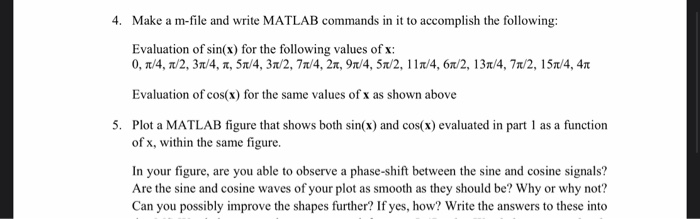
4. Make a m-file and write MATLAB commands in it to accomplish the following: Evaluation of sin(x) for the following values of x: 0, 1/4, 1/2, 37/4, 7, 5/4, 37/2, 77/4, 21, 91/4, 51/2, 117/4, 67/2, 13/4, 78/2, 158/4, 4 Evaluation of cos(x) for the same values of x as shown above 5. Plot a MATLAB figure that shows both sin(x) and cos(x) evaluated in part 1 as a function of x, within the same figure. In your figure, are you able to observe a phase-shift between the sine and cosine signals? Are the sine and cosine waves of your plot as smooth as they should be? Why or why not? Can you possibly improve the shapes further? If yes, how? Write the answers to these into
Step by Step Solution
There are 3 Steps involved in it

Get step-by-step solutions from verified subject matter experts