

Question: plz solve step by step with formuls The Corrigan Corporation's 2011 and 2012 financial statements follow, along with some industry average ratios. a. Assess Corrigan's
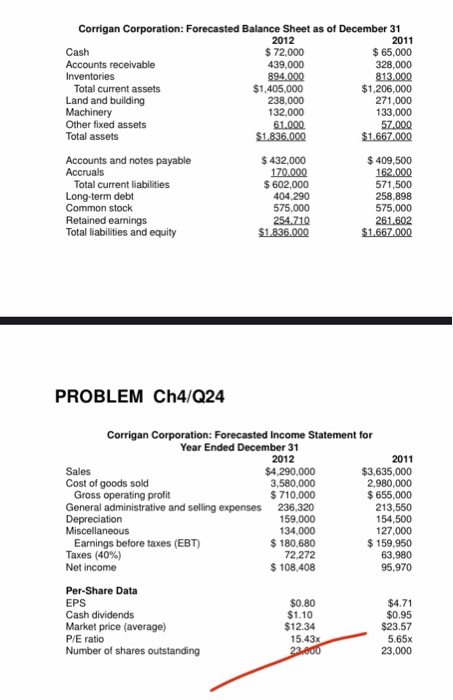
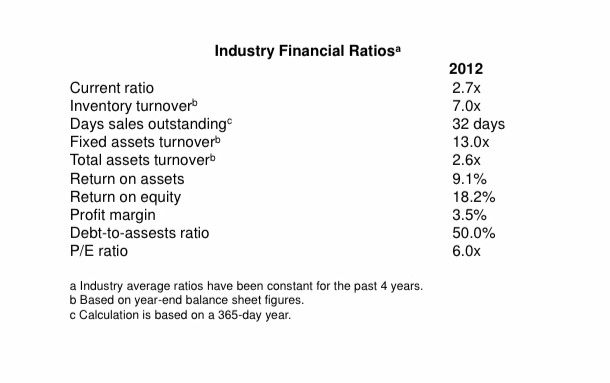
The Corrigan Corporation's 2011 and 2012 financial statements follow, along with some industry average ratios. a. Assess Corrigan's liquidity position and determine how it compares with peers and how the liquidity position has changed over time. b. Assess Corrigan's asset management position and determine how it compares with peers and how its asset management efficiency has changed over time. c. Assess Corrgigan's debt management position and determine how it compares with peers and how its debt management has changed over time. PROBLEM Ch4/Q24 d. Assess Corrigan's profitability ratios and determine how they compare with peers and how its profitability position has changed over time. e. Assess Comrigan's market value ratios and determine how its valuation compares with peers and how it has changed over time. f. Calculate Corrigan's ROE as well as the industry average ROE using the DuPont equation. From this analysis, how does Corrigan's financial position compare with the industry average numbers? g. What do you think would happen to its ratios if the company initiated cost cutting measures that allowed it to hold lower levels of inventoryy and substantially decreased the cost of goods sold? No calculations are necessary Think about which ratios would be affected by changes in these two accounts Corrigan Corporation: Forecasted Balance Sheet as of December 31 2011 2012 Cash $72,000 $65,000 328,000 813.000 $1,206,000 271,000 133,000 57.000 $1.667.000 Accounts receivable Inventories 439,000 894.000 $1,405,000 238,000 132,000 61.000 $1.836.000 Total current assets Land and building Machinery Other fixed assets Total assets Accounts and notes payable Accruals Total current liabilities $ 432,000 170.000 $602,000 404,290 575,000 254.710 $1836.000 $409,500 162.000 571,500 258,898 575,000 261.602 $1.667.000 Long-term debt Common stock Retained earnings Total liabilities and equity PROBLEM Ch4/Q24 Corrigan Corporation: Forecasted Income Statement for Year Ended December 31 2012 $4,290,000 3,580,000 $710,000 General administrative and selling expenses 236,320 159,000 134,000 $180,680 72,272 $108,408 2011 $3,635,000 2,980,000 $655,000 213,550 154,500 127,000 $159,950 63,980 95,970 Sales Cost of goods sold Gross operating profit Depreciation Miscellaneous Earnings before taxes (EBT) Taxes (40%) Net income Per-Share Data EPS Cash dividends Market price (average) P/E ratio Number of shares outstanding $0.80 $1.10 $12.34 15.43x 23800 $4.71 $0.95 $23.57 5.65x 23,000 Industry Financial Ratiosa 2012 2.7x 7.0x 32 days Current ratio Inventory turnover Days sales outstanding Fixed assets turnover 13.0x Total assets turnoverb 2.6x Return on assets Return on equity Profit margin Debt-to-assests ratio P/E ratio 9.1% 18.2% 3.5% 50.0% 6.0x a Industry average ratios have been constant for the past 4 years. b Based on year-end balance sheet figures. c Calculation is based on a 365-day year
Step by Step Solution
There are 3 Steps involved in it

Get step-by-step solutions from verified subject matter experts