

Question: plz use excel, add the equation for the graph and add titles. Graphical Analysis versus To find the equilibrium constant (Ka) of bromocresol green we
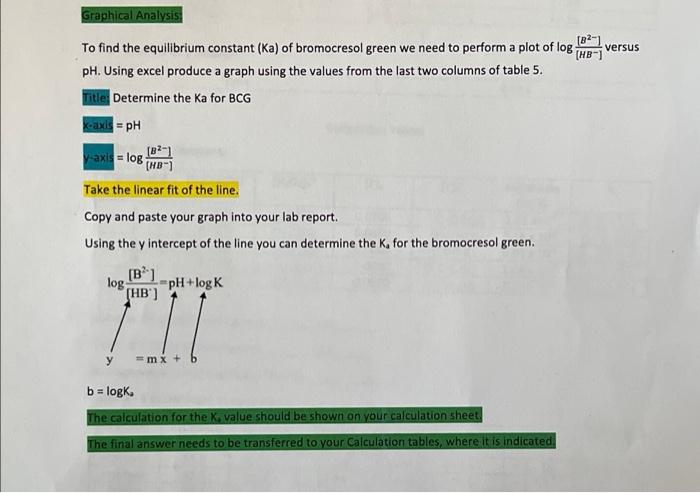
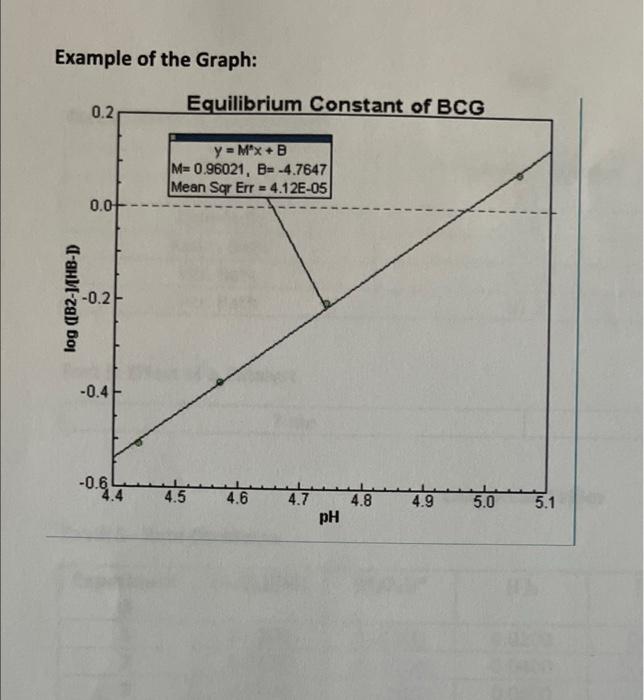
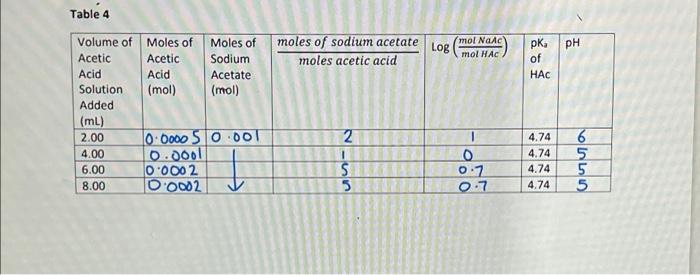
Graphical Analysis versus To find the equilibrium constant (Ka) of bromocresol green we need to perform a plot of log He- pH. Using excel produce a graph using the values from the last two columns of table 5. Title Determine the Ka for BCG -axis - pH V-axis = log (HB-1 Take the linear fit of the line. Copy and paste your graph into your lab report. Using the y intercept of the line you can determine the K, for the bromocresol green. [B'] log pH +log K (HB) = mx + b b = logK. The calculation for the K, value should be shown on your calculation sheet The final answer needs to be transferred to your Calculation tables, where it is indicated Example of the Graph: 0.2 Equilibrium Constant of BCG y = M*x+B M=0.96021, B= -4.7647 Mean Sqr Err = 4.12E-05 0.0 log ([B2-14HB-D -0.2 -0.4 -0.6 4.4 4.5 4.6 4.7 4.8 4.9 5.0 5.1 pH Table 4 LOR mol Nanc mol HAC PH pk of HAC Volume of Moles of Moles of moles of sodium acetate Acetic Acetic Sodium moles acetic acid Acid Acid Acetate Solution (mol) (mol) Added (mL) 2.00 0.0000 510.001 2 4.00 0.0001 1 6.00 0.0002 8.00 O 0002 5 I 4.74 4.74 4.74 4.74 0 0:7 0.7 6 5 5 5 TILLO um
Step by Step Solution
There are 3 Steps involved in it

Get step-by-step solutions from verified subject matter experts