

Question: plz use python solve these two, how to make the width of label(the key which is'b c d a') is 7(include key).thanks Define a function
 plz use python solve these two, how to make the width of label(the key which is'b c d a') is 7(include key).thanks
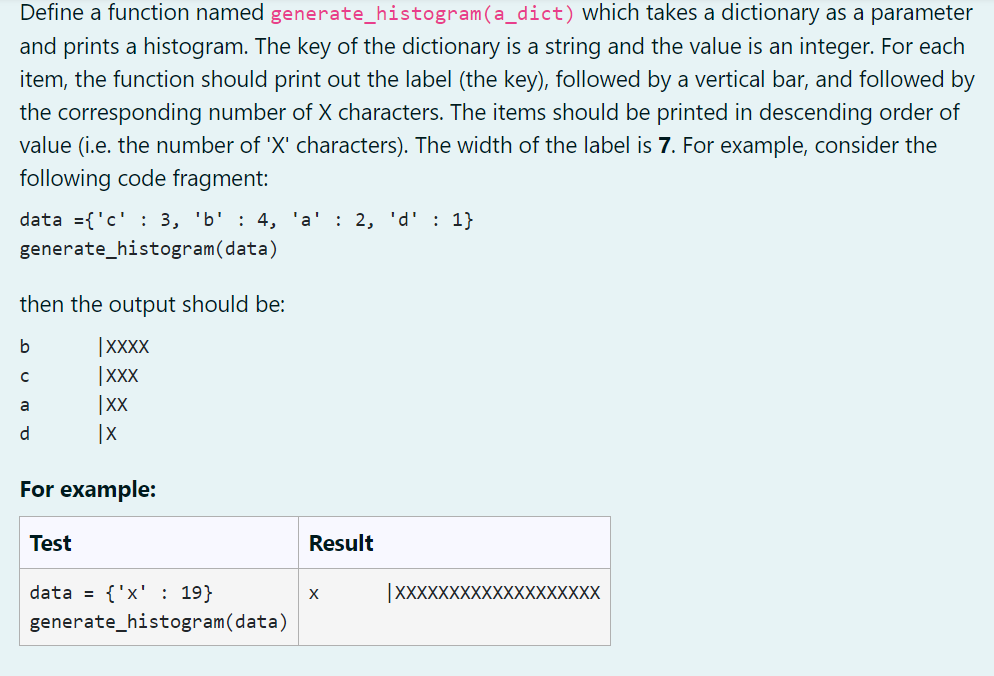
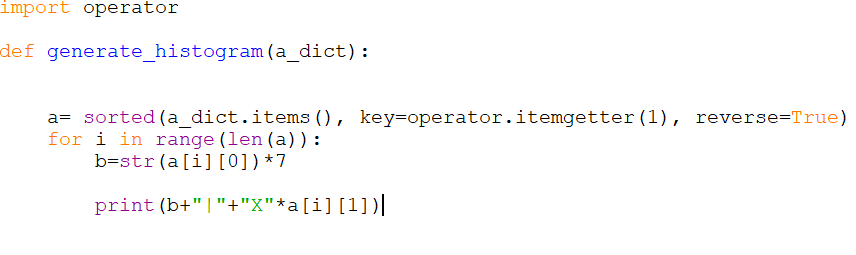
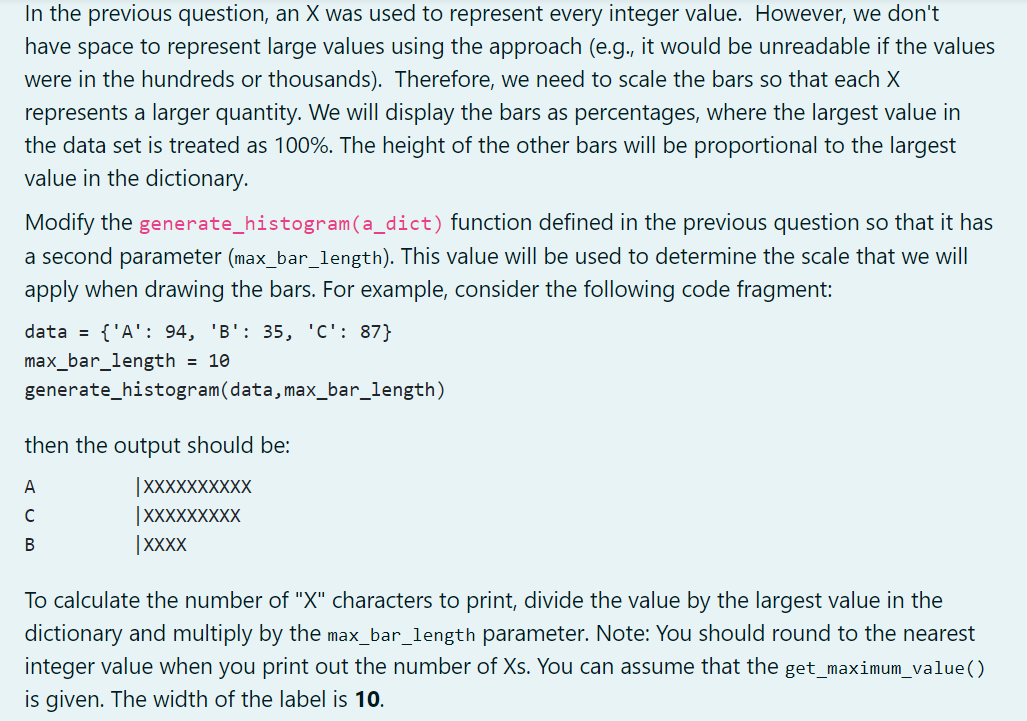
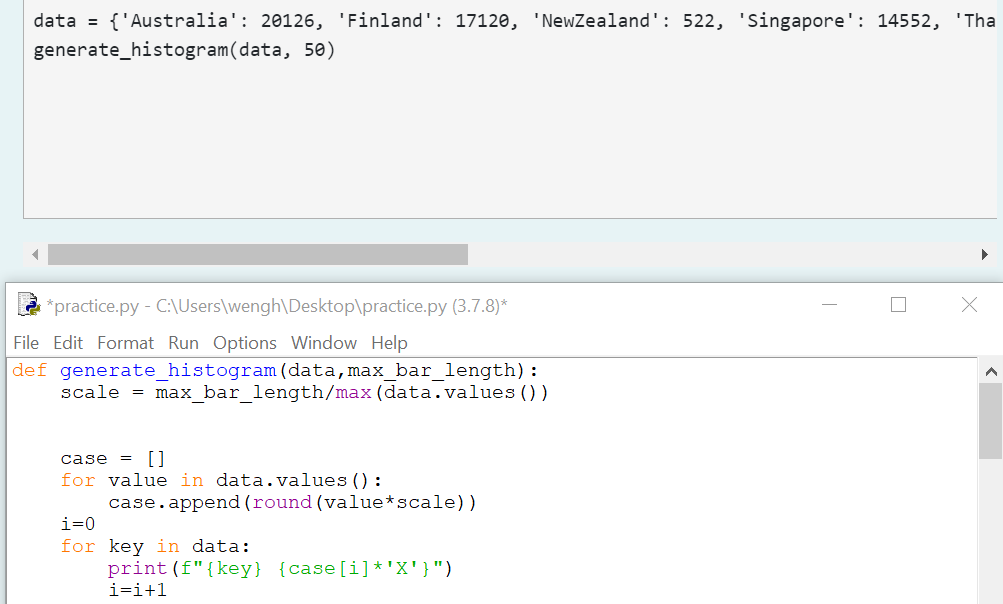
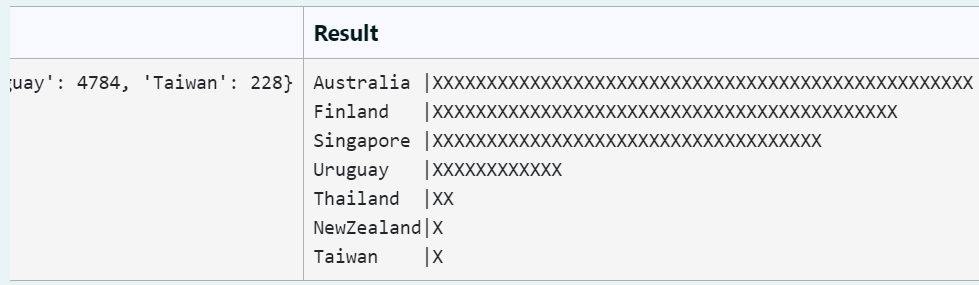
Define a function named generate_histogram(a_dict) which takes a dictionary as a parameter and prints a histogram. The key of the dictionary is a string and the value is an integer. For each item, the function should print out the label (the key), followed by a vertical bar, and followed by the corresponding number of X characters. The items should be printed in descending order of value (i.e. the number of 'X' characters). The width of the label is 7. For example, consider the following code fragment: data ={'c': 3, 'b' : 4, 'a': 2, 'd' : 1} generate_histogram(data) then the output should be: b |XXXX |XXX |XX d X a For example: Test Result |XXXXXXXXXXXXXXXXXXX data = {'X' : 19} generate_histogram(data) import operator def generate_histogram (a_dict): a= sorted (a_dict.items (), key=operator.itemgetter(1), reverse=True) for i in range (len (a)): b=str(a[i][0])+7 print (b+"|"+"X"*a[i][1])| In the previous question, an X was used to represent every integer value. However, we don't have space to represent large values using the approach (e.g., it would be unreadable if the values were in the hundreds or thousands). Therefore, we need to scale the bars so that each X represents a larger quantity. We will display the bars as percentages, where the largest value in the data set is treated as 100%. The height of the other bars will be proportional to the largest value in the dictionary. Modify the generate_histogram(a_dict) function defined in the previous question so that it has a second parameter (max_bar_length). This value will be used to determine the scale that we will apply when drawing the bars. For example, consider the following code fragment: {'A': 94, 'B': 35, 'C': 87} max_bar_length = 10 generate_histogram(data,max_bar_length) data = then the output should be: A |XXXXXXXXXX |XXXXXXXXX | XXXX B To calculate the number of "X" characters to print, divide the value by the largest value in the dictionary and multiply by the max_bar_length parameter. Note: You should round to the nearest integer value when you print out the number of Xs. You can assume that the get_maximum_value() is given. The width of the label is 10. data = { 'Australia': 20126, 'Finland': 17120, 'NewZealand': 522, 'Singapore': 14552, 'Tha generate_histogram(data, 50) *practice.py - C:\Users\wengh\Desktop\practice.py (3.7.8)* File Edit Format Run Options Window Help def generate_histogram (data, max_bar_length): scale = max_bar_length/max (data.values()) case = [] for value in data.values(): case.append(round (value*scale)) i=0 for key in data: print (f"{key} {case[i]*'X'}") i=i+1 Result XXXXXXXXXXXXXX XXXXXXXXXX XXXXXXXXXXXXXXX juay': 4784, 'Taiwan': 228} Australia |XXXXXXXXXX Finland |XXXXXXXXX Singapore | XXXXXXXXXXXXXXX Uruguay |XXXXXXXXXXXX Thailand |XX NewZealand | Taiwan x
Step by Step Solution
There are 3 Steps involved in it

Get step-by-step solutions from verified subject matter experts