

Question: Plzz solve this problem..Thank u Question 2 Needs Grading Assume that you have some stationary time-series data. To understand the auto-correlation structure you analyze the
Plzz solve this problem..Thank u
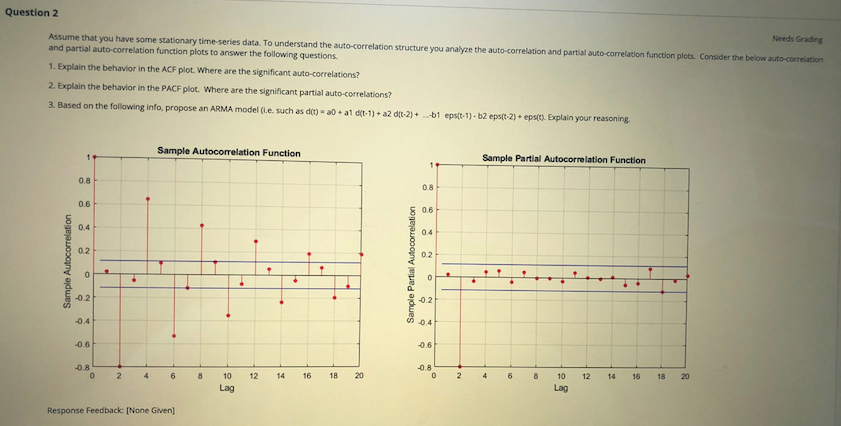
Question 2 Needs Grading Assume that you have some stationary time-series data. To understand the auto-correlation structure you analyze the auto-correlation and partial auto-correlation function plots. Consider the below auto-correlation and partial auto-correlation function plots to answer the following questions. 1. Explain the behavior in the ACF plot. Where are the significant auto-correlations? 2. Explain the behavior in the PACF plot. Where are the significant partial auto-correlations? 3. Based on the following info, propose an ARMA model (i.e. such as d(t) = 20 + al d(t-1) + a2 d(t.2)+ --b1 eps(t-1] - b2 eps(:-2) + eps(t). Explain your reasoning. Sample Autocorrelation Function Sample Partial Autocorrelation Function 0.8 0.B 0.6 0.6 0.4 04 02 0.2 Sample Partial Autocorrelation Sample Autocorrelation -0.2 -0.2 0.4 -0.4 -0.6 -0.6 -0.8 2 10 12 14 16 18 20 2 6 8 10 12 14 16 18 Log Lag Response Feedback: [None Given]
Step by Step Solution
There are 3 Steps involved in it

Get step-by-step solutions from verified subject matter experts