

Question: Point 1 : Development of the new system will initially require an initial capital expenditure equal to 10% of IBMs Net Property, Plant, and Equipment
Point 1: Development of the new system will initially require an initial capital expenditure equal to 10% of IBMs Net Property, Plant, and Equipment (PPE) in 2019 or data from 12/31/2019.
Point 2: The product is expected to have a life of five years.
Point 3: First-year revenues for the new product are expected to be 3% of IBMs total revenue for the using fiscal year 2019 or data from 12/31/2019.
Point 4: The new products revenues are expected to grow at 15% for the second year then 10% for the third and 5% annually for the final two years of the expected life of the project.
Your job is to determine the rest of the cash flows associated with this project. Your boss has indicated that the operating costs and net working capital requirements are similar to the rest of the company (implying the project will have the same ratio of EBITDA to sales and working capital to sales) and that depreciation is straight-line (over 5 years) for capital budgeting purposes. Since your boss hasnt been much help (welcome to the real world!), here are some tips to guide your analysis:
Point 5: Use the data from the spreadsheet that I have provided.
Point 6: Determine the annual depreciation by assuming IBM depreciates these assets by the straight-line method over a five-year life (i.e., depreciate the cost of the new system in Point 1).
Point 7: Determine IBMs tax rate by using the current U.S. federal corporate income tax rate (Use an estimated 21% for the corporate tax rate).
Point 8: In year 1, you are going to increase NWC using the NWC / Sales ratio for IBM in 12/31/2019 using only A/R, A/P, and inventory to measure NWC (use Table 8.3 and 8.4 as a guide for how to bring the increase in NWC into your FCF estimate in year one and take it back out in year 5for simplicity purposes we are going to assume that NWC remains fixed in years 2 through 4 and then it is recaptured in year 5).
Point 9: To determine the free cash flow, deduct the additional capital investment and the change in net working capital each year (note: using information from Point 8, the NWC will only change in years 1 and 5see Table 8.3 line item 12 and Table 8.4 as an example).
Point 10: Use Excel to determine the NPV of the project with a 12% cost of capital. Also calculate the IRR of the project using Excels IRR function.
Point 11: Perform a sensitivity analysis by varying the project forecasts as follows:
a. Suppose first year sales will equal 2%4% of IBMs revenues.
b. Suppose the cost of capital is 10%15%.
c. Suppose revenue growth is constant after the first year at a rate of 0%10%.
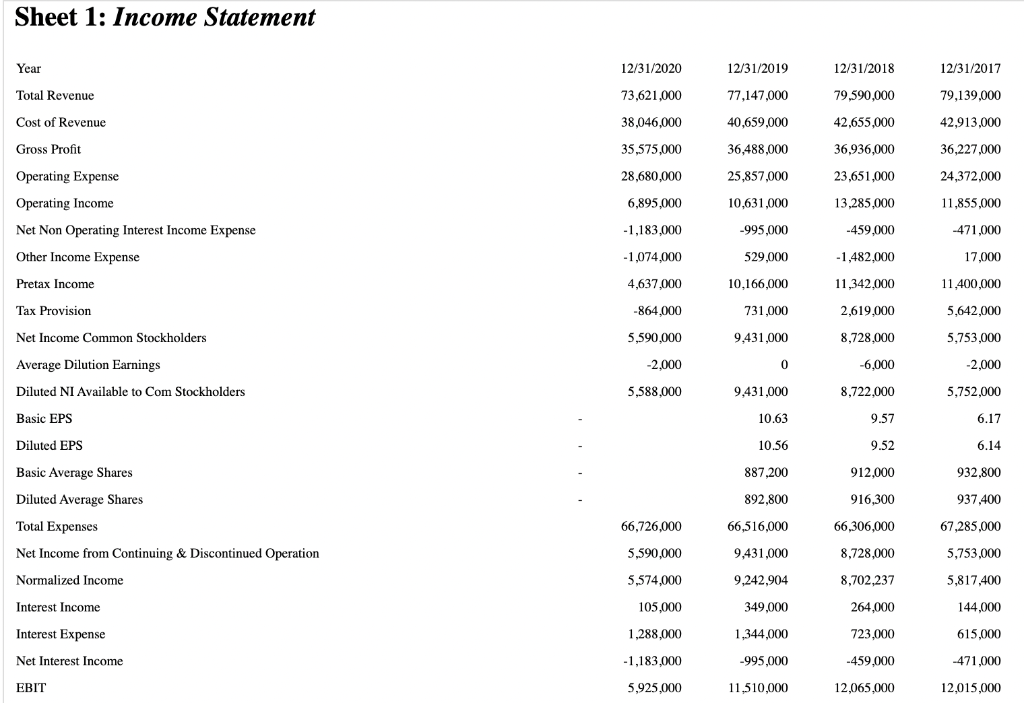
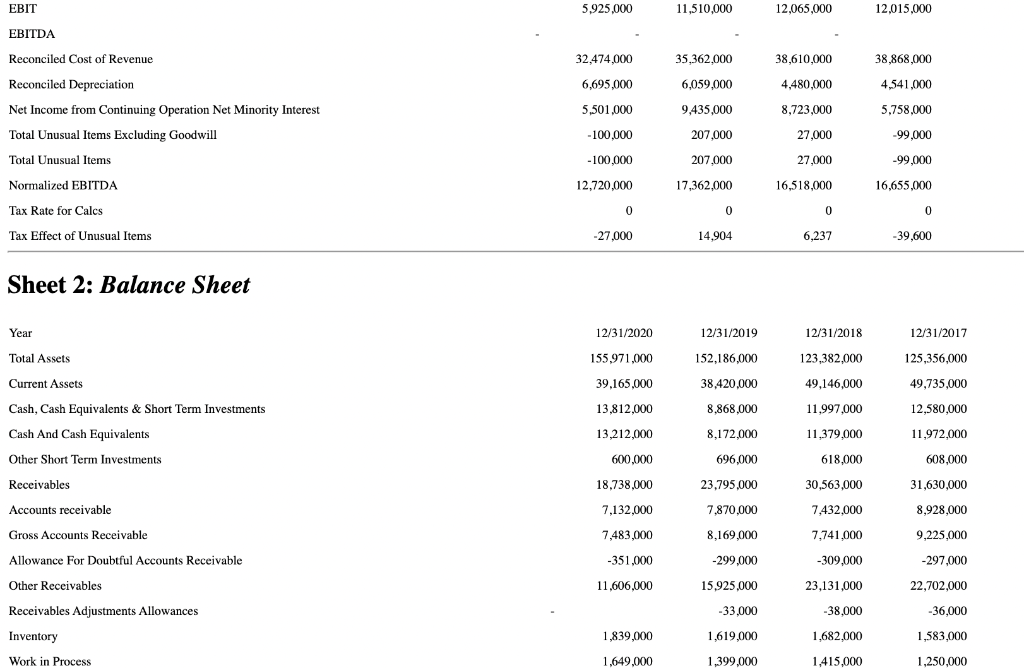
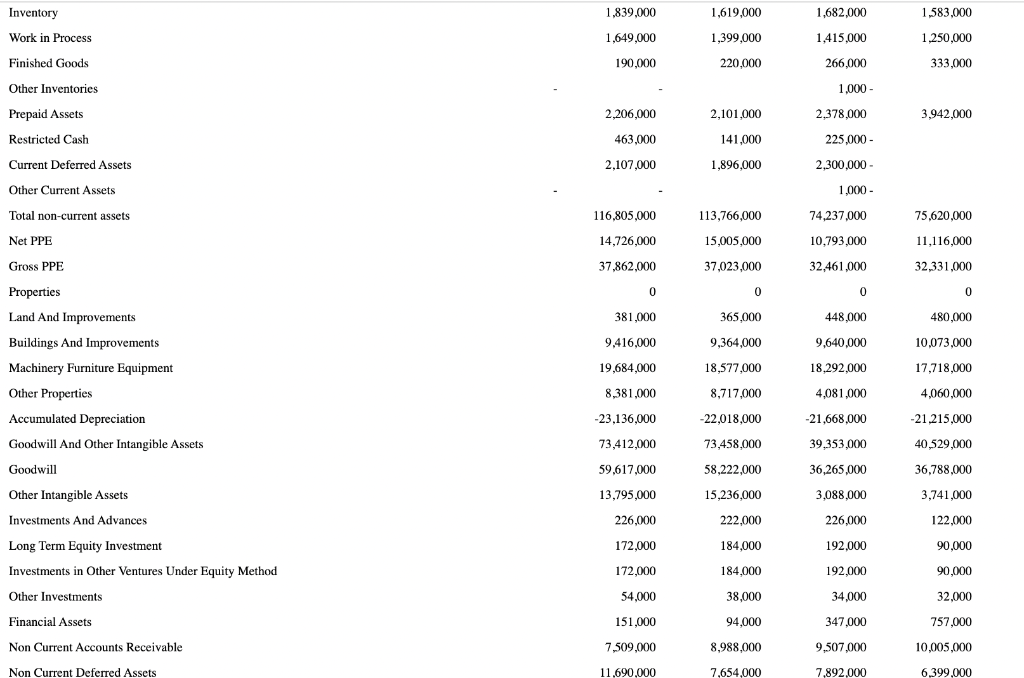
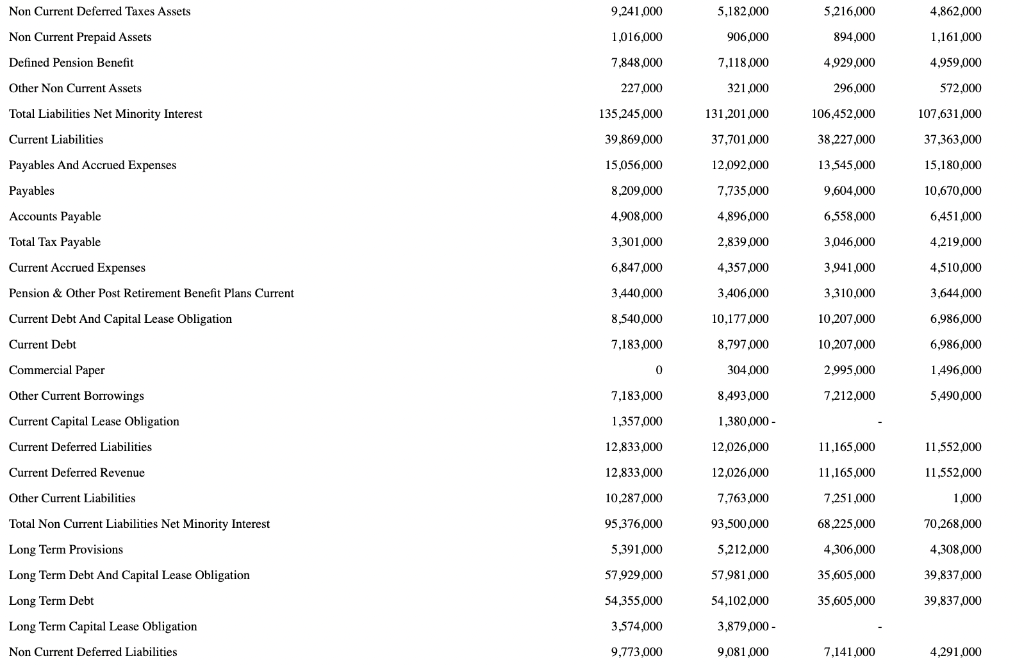
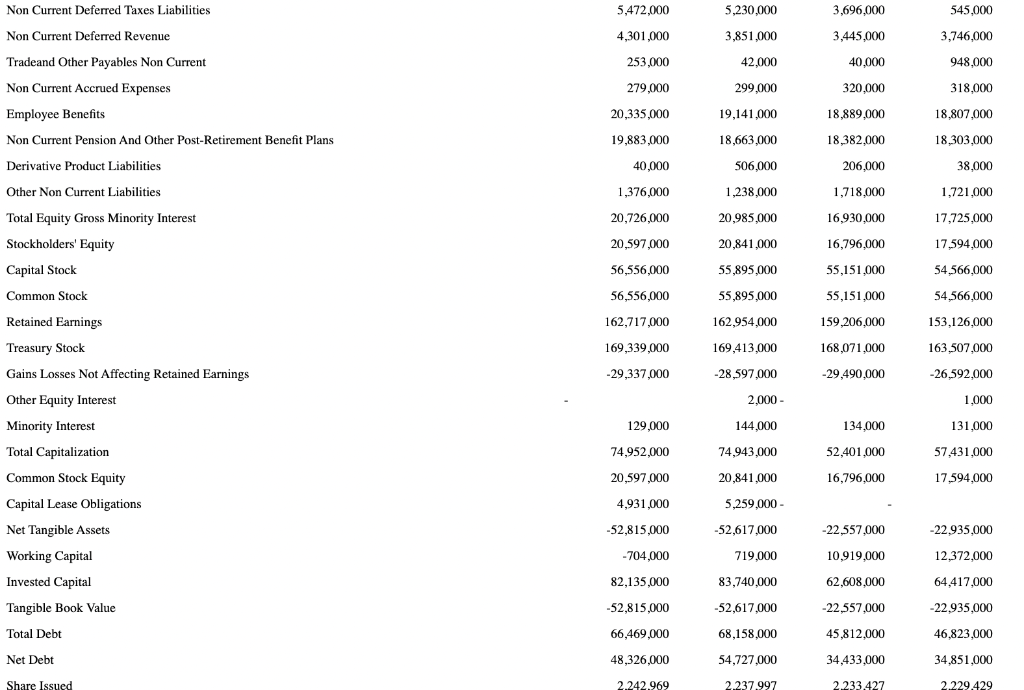
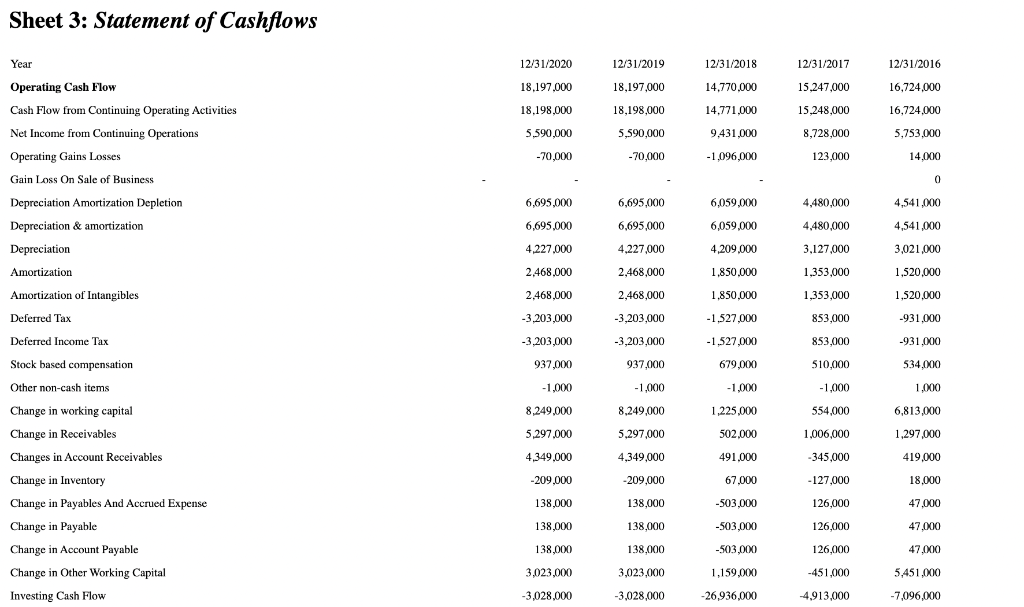
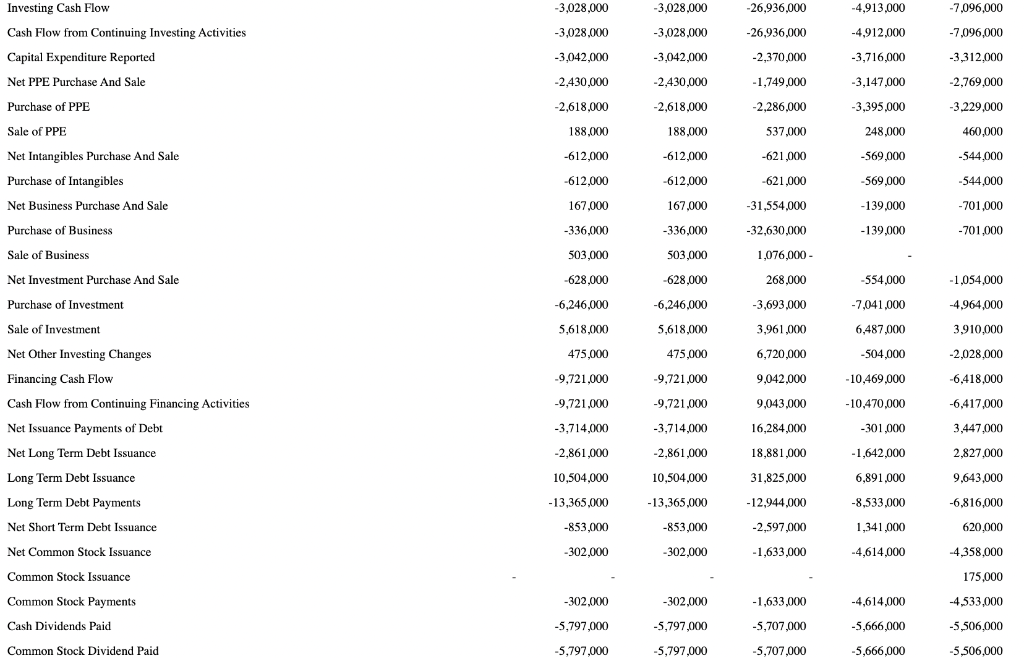
Sheet 1: Income Statement Year Total Revenue Cost of Revenue Gross Profit Operating Expense Operating Income Net Non Operating Interest Income Expense Other Income Expense Pretax Income Tax Provision Net Income Common Stockholders Average Dilution Earnings Diluted NI Available to Com Stockholders Basic EPS Diluted EPS Basic Average Shares Diluted Average Shares Total Expenses Net Income from Continuing & Discontinued Operation Normalized Income Interest Income Interest Expense Net Interest Income EBIT 12/31/2020 73,621,000 38,046,000 35,575,000 28,680,000 6,895,000 -1,183,000 -1,074,000 4,637,000 -864,000 5,590,000 -2,000 5,588,000 66,726,000 5,590,000 5,574,000 105,000 1,288,000 -1,183,000 5,925,000 12/31/2019 77,147,000 40,659,000 36,488,000 25,857,000 10,631,000 -995,000 529,000 10,166,000 731,000 9,431,000 0 9,431,000 10.63 10.56 887,200 892,800 66,516,000 9,431,000 9,242,904 349,000 1,344,000 -995,000 11,510,000 12/31/2018 79,590,000 42,655,000 36,936,000 23,651,000 13,285,000 -459,000 -1,482,000 11,342,000 2,619,000 8,728,000 -6,000 8,722,000 9.57 9.52 912,000 916,300 66,306,000 8,728,000 8,702,237 264,000 723,000 -459,000 12,065,000 12/31/2017 79,139,000 42,913,000 36,227,000 24,372,000 11,855,000 -471,000 17,000 11,400,000 5,642,000 5,753,000 -2,000 5,752,000 6.17 6.14 932,800 937,400 67,285,000 5,753,000 5,817,400 144,000 615,000 -471,000 12,015,000 EBIT EBITDA Reconciled Cost of Revenue Reconciled Depreciation Net Income from Continuing Operation Net Minority Interest Total Unusual Items Excluding Goodwill Total Unusual Items. Normalized EBITDA Tax Rate for Calcs Tax Effect of Unusual Items Sheet 2: Balance Sheet Year Total Assets Current Assets Cash, Cash Equivalents & Short Term Investments Cash And Cash Equivalents Other Short Term Investments Receivables Accounts receivable Gross Accounts Receivable Allowance For Doubtful Accounts Receivable Other Receivables. Receivables Adjustments Allowances Inventory Work in Process 5,925,000 32,474,000 6,695,000 5,501,000 -100,000 -100,000 12,720,000 0 -27,000 12/31/2020 155,971,000 39,165,000 13,812,000 13,212,000 600,000 18,738,000 7,132,000 7,483,000 -351,000 11,606,000 1,839,000 1,649,000 11,510,000 35,362,000 6,059,000 9,435,000 207,000 207,000 17,362,000 0 14,904 12/31/2019 152,186,000 38,420,000 8,868,000 8,172,000 696,000 23,795,000 7,870,000 8,169,000 -299,000 15,925,000 -33,000 1,619,000 1,399,000 12,065,000 38,610,000 4,480,000 8,723,000 27,000 27,000 16,518,000 0 6,237 12/31/2018 123,382,000 49,146,000 11,997,000 11,379,000 618,000 30,563,000 7,432,000 7,741,000 -309,000 23,131,000 -38,000 1,682,000 1,415,000 12,015,000 38,868,000 4,541,000 5,758,000 -99,000 -99,000 16,655,000 0 -39,600 12/31/2017 125,356,000 49,735,000 12,580,000 11,972,000 608,000 31,630,000 8,928,000 9,225,000 -297,000 22,702,000 -36,000 1,583,000 1,250,000 Inventory Work in Process Finished Goods Other Inventories Prepaid Assets Restricted Cash Current Deferred Assets Other Current Assets Total non-current assets Net PPE Gross PPE Properties Land And Improvements Buildings And Improvements Machinery Furniture Equipment Other Properties Accumulated Depreciation Goodwill And Other Intangible Assets Goodwill Other Intangible Assets Investments And Advances Long Term Equity Investment Investments in Other Ventures Under Equity Method Other Investments Financial Assets Non Current Accounts Receivable Non Current Deferred Assets 1,839,000 1,649,000 190,000 2,206,000 463,000 2,107,000 116,805,000 14,726,000 37,862,000 0 381,000 9,416,000 19,684,000 8,381,000 -23,136,000 73,412,000 59,617,000 13,795,000 226,000 172,000 172,000 54,000 151,000 7,509,000 11,690,000 1,619,000 1,399,000 220,000 2,101,000 141,000 1,896,000 113.766,000 15,005,000 37,023,000 0 365,000 9,364,000 18,577,000 8,717,000 -22,018,000 73,458,000 58,222,000 15,236,000 222,000 184,000 184,000 38,000 94,000 8,988,000 7,654,000 1,682,000 1,415,000 266,000 1,000- 2,378,000 225,000- 2.300.000- 1,000- 74,237,000 10,793,000 32,461,000 0 448,000 9,640,000 18,292,000 4,081,000 -21,668,000 39,353,000 36,265,000 3,088,000 226,000 192.000 192,000 34,000 347,000 9,507,000 7,892,000 1,583,000 1,250,000 333,000 3,942,000 75,620,000 11,116,000 32,331,000 0 480,000 10,073,000 17,718,000 4,060,000 -21,215,000 40,529,000 36,788,000 3,741,000 122,000 90,000 90,000 32,000 757,000 10,005,000 6,399,000 Current Deferred Taxes Assets. Current Prepaid Assets Non Non Defined Pension Benefit. Other Non Current Assets Total Liabilities Net Minority Interest Current Liabilities Payables And Accrued Expenses. Payables Accounts Payable Total Tax Payable Current Accrued Expenses Pension & Other Post Retirement Benefit Plans Current Current Debt And Capital Lease Obligation Current Debt Commercial Paper Other Current Borrowings Current Capital Lease Obligation Current Deferred Liabilities Current Deferred Revenue Other Current Liabilities Total Non Current Liabilities Net Minority Interest Long Term Provisions Long Term Debt And Capital Lease Obligation Long Term Debt Long Term Capital Lease Obligation Non Current Deferred Liabilities 9,241,000 1,016,000 7,848,000 227,000 135,245,000 39,869,000 15,056,000 8,209,000 4,908,000 3,301,000 6,847,000 3,440,000 8,540,000 7,183,000 0 7,183,000 1,357,000 12,833,000 12,833,000 10,287,000 95,376,000 5,391,000 57,929.000 54,355,000 3,574,000 9,773,000 5,182,000 906,000 7,118,000 321,000 131,201,000 37,701,000 12,092,000 7,735,000 4,896,000 2,839,000 4,357,000 3,406,000 10,177,000 8,797,000 304,000 8,493,000 1,380,000 - 12,026,000 12,026,000 7,763,000 93,500,000 5,212,000 57,981,000 54,102,000 3,879,000 - 9,081,000 5,216,000 894,000 4,929,000 296,000 106,452,000 38,227,000 13,545,000 9,604,000 6,558,000 3,046,000 3,941,000 3,310,000 10,207,000 10,207,000 2,995,000 7,212,000 11,165,000 11,165,000 7,251,000 68,225,000 4,306,000 35,605,000 35,605,000 7,141,000 4,862,000 1,161,000 4,959,000 572,000 107,631,000 37,363,000 15,180,000 10,670,000 6,451,000 4,219,000 4,510,000 3,644,000 6,986,000 6,986,000 1,496,000 5,490,000 11,552,000 11,552,000 1,000 70,268,000 4,308,000 39,837,000 39,837,000 4,291,000 Non Current Deferred Taxes Liabilities. Non Current Deferred Revenue Tradeand Other Payables Non Current Non Current Accrued Expenses Employee Benefits Non Current Pension And Other Post-Retirement Benefit Plans Derivative Product Liabilities Other Non Current Liabilities Total Equity Gross Minority Interest Stockholders' Equity Capital Stock Common Stock Retained Earnings Treasury Stock Gains Losses Not Affecting Retained Earnings Other Equity Interest Minority Interest Total Capitalization Common Stock Equity Capital Lease Obligations Net Tangible Assets Working Capital Invested Capital Tangible Book Value Total Debt Net Debt Share Issued 5,472,000 4,301,000 253,000 279,000 20,335,000 19,883,000 40,000 1,376,000 20,726,000 20,597,000 56,556,000 56,556,000 162,717,000 169,339,000 -29,337,000 129,000 74,952,000 20,597,000 4,931,000 -52,815,000 -704,000 82,135,000 -52,815,000 66,469,000 48,326,000 2,242,969 5,230,000 3,851,000 42,000 299,000 19,141,000 18,663,000 506,000 1,238,000 20,985,000 20,841,000 55,895,000 55,895,000 162,954,000 169,413,000 -28,597,000 2,000 - 144,000 74,943,000 20,841,000 5,259,000 - -52,617,000 719,000 83,740,000 -52,617,000 68,158,000 54,727,000 2.237.997 3,696,000 3,445,000 40,000 320,000 18,889,000 18,382,000 206,000 1,718,000 16,930,000 16,796,000 55,151,000 55,151,000 159,206,000 168,071,000 -29,490,000 134,000 52,401,000 16,796,000 -22,557,000 10,919,000 62,608,000 -22,557,000 45,812,000 34,433,000 2.233.427 545.000 3,746,000 948,000 318,000 18,807,000 18.303,000 38,000 1,721,000 17,725,000 17.594,000 54,566,000 54.566,000 153,126,000 163,507,000 -26,592,000 1,000 131,000 57,431,000 17,594,000 -22,935,000 12,372,000 64,417,000 -22,935,000 46,823,000 34,851,000 2.229.429 Sheet 3: Statement of Cashflows Year Operating Cash Flow Cash Flow from Continuing Operating Activities Net Income from Continuing Operations Operating Gains Losses Gain Loss On Sale of Business Depreciation Amortization Depletion Depreciation & amortization Depreciation Amortization Amortization of Intangibles Deferred Tax Deferred Income Tax Stock based compensation Other non-cash items Change in working capital Change in Receivables Changes in Account Receivables Change in Inventory Change in Payables And Accrued Expense Change in Payable Change in Account Payable Change in Other Working Capital Investing Cash Flow 12/31/2020 18,197,000 18,198,000 5,590,000 -70,000 6,695,000 6,695,000 4,227,000 2,468,000 2,468,000 -3,203,000 -3,203,000 937,000 -1,000 8,249,000 5,297,000 4,349,000 -209,000 138,000 138,000 138,000 3,023,000 -3,028,000 12/31/2019 18,197,000 18,198,000 5,590,000 -70,000 6,695,000 6,695,000 4,227,000 2,468,000 2,468,000 -3,203,000 -3,203,000 937,000 -1,000 8,249,000 5,297,000 4,349,000 -209,000 138,000 138.000 138,000 3,023,000 -3,028,000 12/31/2018 14,770,000 14,771,000 9,431,000 -1,096,000 6,059,000 6,059,000 4,209,000 1,850,000 1,850,000 -1,527,000 -1,527,000 679,000 -1,000 1,225,000 502,000 491,000 67,000 -503,000 -503,000 -503,000 1,159,000 -26,936,000 12/31/2017 15,247,000 15,248,000 8,728,000 123,000 4,480,000 4,480,000 3,127,000 1,353,000 1,353,000 853,000 853,000 510,000 -1,000 554,000 1,006,000 -345,000 -127,000 126,000 126,000 126,000 -451,000 -4,913,000 12/31/2016 16,724,000 16,724,000 5,753,000 14,000 0 4,541,000 4,541,000 3,021,000 1,520,000 1,520,000 -931,000 -931,000 534.000 1,000 6,813,000 1,297,000 419,000 18,000 47,000 47,000 47,000 5,451,000 -7,096,000 Investing Cash Flow Cash Flow from Continuing Investing Activities Capital Expenditure Reported Net PPE Purchase And Sale Purchase of PPE Sale of PPE Net Intangibles Purchase And Sale Purchase of Intangibles Net Business Purchase And Sale Purchase of Business. Sale of Business Net Investment Purchase And Sale Purchase of Investment Sale of Investment Net Other Investing Changes Financing Cash Flow Cash Flow from Continuing Financing Activities Net Issuance Payments of Debt Net Long Term Debt Issuance Long Term Debt Issuance Long Term Debt Payments Net Short Term Debt Issuance Net Common Stock Issuance Common Stock Issuance Common Stock Payments Cash Dividends Paid Common Stock Dividend Paid -3,028,000 -3,028,000 -3,042,000 -2,430,000 -2,618,000 188,000 -612,000 -612,000 167,000 -336,000 503,000 -628,000 -6,246,000 5,618,000 475,000 -9,721,000 -9,721,000 -3,714,000 -2,861,000 10,504,000 -13,365,000 -853,000 -302,000 -302,000 -5,797,000 -5,797,000 -3,028,000 -3,028,000 -3,042,000 -2,430,000 -2,618,000 188,000 -612,000 -612,000 167,000 -336,000 503,000 -628,000 -6,246,000 5,618,000 475,000 -9,721,000 -9,721,000 -3,714,000 -2,861,000 10,504,000 -13,365,000 -853,000 -302,000 -302,000 -5,797,000 -5,797,000 -26,936,000 -26,936,000 -2,370,000 -1,749,000 -2,286,000 537,000 -621,000 -621,000 -31,554,000 -32,630,000 1,076,000- 268,000 -3,693,000 3,961,000 6,720,000 9,042,000 9,043,000 16,284,000 18,881,000 31,825,000 -12,944,000 -2,597,000 -1,633,000 -1,633,000 -5,707,000 -5,707,000 -4,913,000 -4,912,000 -3,716,000 -3,147,000 -3,395,000 248,000 -569,000 -569,000 -139,000 -139,000 -554,000 -7,041,000 6,487,000 -504,000 -10,469,000 -10,470,000 -301,000 -1,642,000 6,891,000 -8,533,000 1,341,000 -4,614,000 -4,614,000 -5,666,000 -5,666,000 -7,096,000 -7,096,000 -3,312,000 -2,769,000 -3,229,000 460,000 -544,000 -544,000 -701,000 -701,000 -1,054,000 -4,964,000 3,910,000 -2,028,000 -6,418,000 -6,417,000 3,447,000 2,827,000 9,643,000 -6,816,000 620,000 -4,358,000 175,000 -4,533,000 -5.506,000 -5.506,000 Sheet 1: Income Statement Year Total Revenue Cost of Revenue Gross Profit Operating Expense Operating Income Net Non Operating Interest Income Expense Other Income Expense Pretax Income Tax Provision Net Income Common Stockholders Average Dilution Earnings Diluted NI Available to Com Stockholders Basic EPS Diluted EPS Basic Average Shares Diluted Average Shares Total Expenses Net Income from Continuing & Discontinued Operation Normalized Income Interest Income Interest Expense Net Interest Income EBIT 12/31/2020 73,621,000 38,046,000 35,575,000 28,680,000 6,895,000 -1,183,000 -1,074,000 4,637,000 -864,000 5,590,000 -2,000 5,588,000 66,726,000 5,590,000 5,574,000 105,000 1,288,000 -1,183,000 5,925,000 12/31/2019 77,147,000 40,659,000 36,488,000 25,857,000 10,631,000 -995,000 529,000 10,166,000 731,000 9,431,000 0 9,431,000 10.63 10.56 887,200 892,800 66,516,000 9,431,000 9,242,904 349,000 1,344,000 -995,000 11,510,000 12/31/2018 79,590,000 42,655,000 36,936,000 23,651,000 13,285,000 -459,000 -1,482,000 11,342,000 2,619,000 8,728,000 -6,000 8,722,000 9.57 9.52 912,000 916,300 66,306,000 8,728,000 8,702,237 264,000 723,000 -459,000 12,065,000 12/31/2017 79,139,000 42,913,000 36,227,000 24,372,000 11,855,000 -471,000 17,000 11,400,000 5,642,000 5,753,000 -2,000 5,752,000 6.17 6.14 932,800 937,400 67,285,000 5,753,000 5,817,400 144,000 615,000 -471,000 12,015,000 EBIT EBITDA Reconciled Cost of Revenue Reconciled Depreciation Net Income from Continuing Operation Net Minority Interest Total Unusual Items Excluding Goodwill Total Unusual Items. Normalized EBITDA Tax Rate for Calcs Tax Effect of Unusual Items Sheet 2: Balance Sheet Year Total Assets Current Assets Cash, Cash Equivalents & Short Term Investments Cash And Cash Equivalents Other Short Term Investments Receivables Accounts receivable Gross Accounts Receivable Allowance For Doubtful Accounts Receivable Other Receivables. Receivables Adjustments Allowances Inventory Work in Process 5,925,000 32,474,000 6,695,000 5,501,000 -100,000 -100,000 12,720,000 0 -27,000 12/31/2020 155,971,000 39,165,000 13,812,000 13,212,000 600,000 18,738,000 7,132,000 7,483,000 -351,000 11,606,000 1,839,000 1,649,000 11,510,000 35,362,000 6,059,000 9,435,000 207,000 207,000 17,362,000 0 14,904 12/31/2019 152,186,000 38,420,000 8,868,000 8,172,000 696,000 23,795,000 7,870,000 8,169,000 -299,000 15,925,000 -33,000 1,619,000 1,399,000 12,065,000 38,610,000 4,480,000 8,723,000 27,000 27,000 16,518,000 0 6,237 12/31/2018 123,382,000 49,146,000 11,997,000 11,379,000 618,000 30,563,000 7,432,000 7,741,000 -309,000 23,131,000 -38,000 1,682,000 1,415,000 12,015,000 38,868,000 4,541,000 5,758,000 -99,000 -99,000 16,655,000 0 -39,600 12/31/2017 125,356,000 49,735,000 12,580,000 11,972,000 608,000 31,630,000 8,928,000 9,225,000 -297,000 22,702,000 -36,000 1,583,000 1,250,000 Inventory Work in Process Finished Goods Other Inventories Prepaid Assets Restricted Cash Current Deferred Assets Other Current Assets Total non-current assets Net PPE Gross PPE Properties Land And Improvements Buildings And Improvements Machinery Furniture Equipment Other Properties Accumulated Depreciation Goodwill And Other Intangible Assets Goodwill Other Intangible Assets Investments And Advances Long Term Equity Investment Investments in Other Ventures Under Equity Method Other Investments Financial Assets Non Current Accounts Receivable Non Current Deferred Assets 1,839,000 1,649,000 190,000 2,206,000 463,000 2,107,000 116,805,000 14,726,000 37,862,000 0 381,000 9,416,000 19,684,000 8,381,000 -23,136,000 73,412,000 59,617,000 13,795,000 226,000 172,000 172,000 54,000 151,000 7,509,000 11,690,000 1,619,000 1,399,000 220,000 2,101,000 141,000 1,896,000 113.766,000 15,005,000 37,023,000 0 365,000 9,364,000 18,577,000 8,717,000 -22,018,000 73,458,000 58,222,000 15,236,000 222,000 184,000 184,000 38,000 94,000 8,988,000 7,654,000 1,682,000 1,415,000 266,000 1,000- 2,378,000 225,000- 2.300.000- 1,000- 74,237,000 10,793,000 32,461,000 0 448,000 9,640,000 18,292,000 4,081,000 -21,668,000 39,353,000 36,265,000 3,088,000 226,000 192.000 192,000 34,000 347,000 9,507,000 7,892,000 1,583,000 1,250,000 333,000 3,942,000 75,620,000 11,116,000 32,331,000 0 480,000 10,073,000 17,718,000 4,060,000 -21,215,000 40,529,000 36,788,000 3,741,000 122,000 90,000 90,000 32,000 757,000 10,005,000 6,399,000 Current Deferred Taxes Assets. Current Prepaid Assets Non Non Defined Pension Benefit. Other Non Current Assets Total Liabilities Net Minority Interest Current Liabilities Payables And Accrued Expenses. Payables Accounts Payable Total Tax Payable Current Accrued Expenses Pension & Other Post Retirement Benefit Plans Current Current Debt And Capital Lease Obligation Current Debt Commercial Paper Other Current Borrowings Current Capital Lease Obligation Current Deferred Liabilities Current Deferred Revenue Other Current Liabilities Total Non Current Liabilities Net Minority Interest Long Term Provisions Long Term Debt And Capital Lease Obligation Long Term Debt Long Term Capital Lease Obligation Non Current Deferred Liabilities 9,241,000 1,016,000 7,848,000 227,000 135,245,000 39,869,000 15,056,000 8,209,000 4,908,000 3,301,000 6,847,000 3,440,000 8,540,000 7,183,000 0 7,183,000 1,357,000 12,833,000 12,833,000 10,287,000 95,376,000 5,391,000 57,929.000 54,355,000 3,574,000 9,773,000 5,182,000 906,000 7,118,000 321,000 131,201,000 37,701,000 12,092,000 7,735,000 4,896,000 2,839,000 4,357,000 3,406,000 10,177,000 8,797,000 304,000 8,493,000 1,380,000 - 12,026,000 12,026,000 7,763,000 93,500,000 5,212,000 57,981,000 54,102,000 3,879,000 - 9,081,000 5,216,000 894,000 4,929,000 296,000 106,452,000 38,227,000 13,545,000 9,604,000 6,558,000 3,046,000 3,941,000 3,310,000 10,207,000 10,207,000 2,995,000 7,212,000 11,165,000 11,165,000 7,251,000 68,225,000 4,306,000 35,605,000 35,605,000 7,141,000 4,862,000 1,161,000 4,959,000 572,000 107,631,000 37,363,000 15,180,000 10,670,000 6,451,000 4,219,000 4,510,000 3,644,000 6,986,000 6,986,000 1,496,000 5,490,000 11,552,000 11,552,000 1,000 70,268,000 4,308,000 39,837,000 39,837,000 4,291,000 Non Current Deferred Taxes Liabilities. Non Current Deferred Revenue Tradeand Other Payables Non Current Non Current Accrued Expenses Employee Benefits Non Current Pension And Other Post-Retirement Benefit Plans Derivative Product Liabilities Other Non Current Liabilities Total Equity Gross Minority Interest Stockholders' Equity Capital Stock Common Stock Retained Earnings Treasury Stock Gains Losses Not Affecting Retained Earnings Other Equity Interest Minority Interest Total Capitalization Common Stock Equity Capital Lease Obligations Net Tangible Assets Working Capital Invested Capital Tangible Book Value Total Debt Net Debt Share Issued 5,472,000 4,301,000 253,000 279,000 20,335,000 19,883,000 40,000 1,376,000 20,726,000 20,597,000 56,556,000 56,556,000 162,717,000 169,339,000 -29,337,000 129,000 74,952,000 20,597,000 4,931,000 -52,815,000 -704,000 82,135,000 -52,815,000 66,469,000 48,326,000 2,242,969 5,230,000 3,851,000 42,000 299,000 19,141,000 18,663,000 506,000 1,238,000 20,985,000 20,841,000 55,895,000 55,895,000 162,954,000 169,413,000 -28,597,000 2,000 - 144,000 74,943,000 20,841,000 5,259,000 - -52,617,000 719,000 83,740,000 -52,617,000 68,158,000 54,727,000 2.237.997 3,696,000 3,445,000 40,000 320,000 18,889,000 18,382,000 206,000 1,718,000 16,930,000 16,796,000 55,151,000 55,151,000 159,206,000 168,071,000 -29,490,000 134,000 52,401,000 16,796,000 -22,557,000 10,919,000 62,608,000 -22,557,000 45,812,000 34,433,000 2.233.427 545.000 3,746,000 948,000 318,000 18,807,000 18.303,000 38,000 1,721,000 17,725,000 17.594,000 54,566,000 54.566,000 153,126,000 163,507,000 -26,592,000 1,000 131,000 57,431,000 17,594,000 -22,935,000 12,372,000 64,417,000 -22,935,000 46,823,000 34,851,000 2.229.429 Sheet 3: Statement of Cashflows Year Operating Cash Flow Cash Flow from Continuing Operating Activities Net Income from Continuing Operations Operating Gains Losses Gain Loss On Sale of Business Depreciation Amortization Depletion Depreciation & amortization Depreciation Amortization Amortization of Intangibles Deferred Tax Deferred Income Tax Stock based compensation Other non-cash items Change in working capital Change in Receivables Changes in Account Receivables Change in Inventory Change in Payables And Accrued Expense Change in Payable Change in Account Payable Change in Other Working Capital Investing Cash Flow 12/31/2020 18,197,000 18,198,000 5,590,000 -70,000 6,695,000 6,695,000 4,227,000 2,468,000 2,468,000 -3,203,000 -3,203,000 937,000 -1,000 8,249,000 5,297,000 4,349,000 -209,000 138,000 138,000 138,000 3,023,000 -3,028,000 12/31/2019 18,197,000 18,198,000 5,590,000 -70,000 6,695,000 6,695,000 4,227,000 2,468,000 2,468,000 -3,203,000 -3,203,000 937,000 -1,000 8,249,000 5,297,000 4,349,000 -209,000 138,000 138.000 138,000 3,023,000 -3,028,000 12/31/2018 14,770,000 14,771,000 9,431,000 -1,096,000 6,059,000 6,059,000 4,209,000 1,850,000 1,850,000 -1,527,000 -1,527,000 679,000 -1,000 1,225,000 502,000 491,000 67,000 -503,000 -503,000 -503,000 1,159,000 -26,936,000 12/31/2017 15,247,000 15,248,000 8,728,000 123,000 4,480,000 4,480,000 3,127,000 1,353,000 1,353,000 853,000 853,000 510,000 -1,000 554,000 1,006,000 -345,000 -127,000 126,000 126,000 126,000 -451,000 -4,913,000 12/31/2016 16,724,000 16,724,000 5,753,000 14,000 0 4,541,000 4,541,000 3,021,000 1,520,000 1,520,000 -931,000 -931,000 534.000 1,000 6,813,000 1,297,000 419,000 18,000 47,000 47,000 47,000 5,451,000 -7,096,000 Investing Cash Flow Cash Flow from Continuing Investing Activities Capital Expenditure Reported Net PPE Purchase And Sale Purchase of PPE Sale of PPE Net Intangibles Purchase And Sale Purchase of Intangibles Net Business Purchase And Sale Purchase of Business. Sale of Business Net Investment Purchase And Sale Purchase of Investment Sale of Investment Net Other Investing Changes Financing Cash Flow Cash Flow from Continuing Financing Activities Net Issuance Payments of Debt Net Long Term Debt Issuance Long Term Debt Issuance Long Term Debt Payments Net Short Term Debt Issuance Net Common Stock Issuance Common Stock Issuance Common Stock Payments Cash Dividends Paid Common Stock Dividend Paid -3,028,000 -3,028,000 -3,042,000 -2,430,000 -2,618,000 188,000 -612,000 -612,000 167,000 -336,000 503,000 -628,000 -6,246,000 5,618,000 475,000 -9,721,000 -9,721,000 -3,714,000 -2,861,000 10,504,000 -13,365,000 -853,000 -302,000 -302,000 -5,797,000 -5,797,000 -3,028,000 -3,028,000 -3,042,000 -2,430,000 -2,618,000 188,000 -612,000 -612,000 167,000 -336,000 503,000 -628,000 -6,246,000 5,618,000 475,000 -9,721,000 -9,721,000 -3,714,000 -2,861,000 10,504,000 -13,365,000 -853,000 -302,000 -302,000 -5,797,000 -5,797,000 -26,936,000 -26,936,000 -2,370,000 -1,749,000 -2,286,000 537,000 -621,000 -621,000 -31,554,000 -32,630,000 1,076,000- 268,000 -3,693,000 3,961,000 6,720,000 9,042,000 9,043,000 16,284,000 18,881,000 31,825,000 -12,944,000 -2,597,000 -1,633,000 -1,633,000 -5,707,000 -5,707,000 -4,913,000 -4,912,000 -3,716,000 -3,147,000 -3,395,000 248,000 -569,000 -569,000 -139,000 -139,000 -554,000 -7,041,000 6,487,000 -504,000 -10,469,000 -10,470,000 -301,000 -1,642,000 6,891,000 -8,533,000 1,341,000 -4,614,000 -4,614,000 -5,666,000 -5,666,000 -7,096,000 -7,096,000 -3,312,000 -2,769,000 -3,229,000 460,000 -544,000 -544,000 -701,000 -701,000 -1,054,000 -4,964,000 3,910,000 -2,028,000 -6,418,000 -6,417,000 3,447,000 2,827,000 9,643,000 -6,816,000 620,000 -4,358,000 175,000 -4,533,000 -5.506,000 -5.506,000
Step by Step Solution
There are 3 Steps involved in it

Get step-by-step solutions from verified subject matter experts