

Question: Points Allocation of Time Math Score Econ Score Math Econ A 1 8 24 100 B 2 7 C 6 62 D 4 5 E
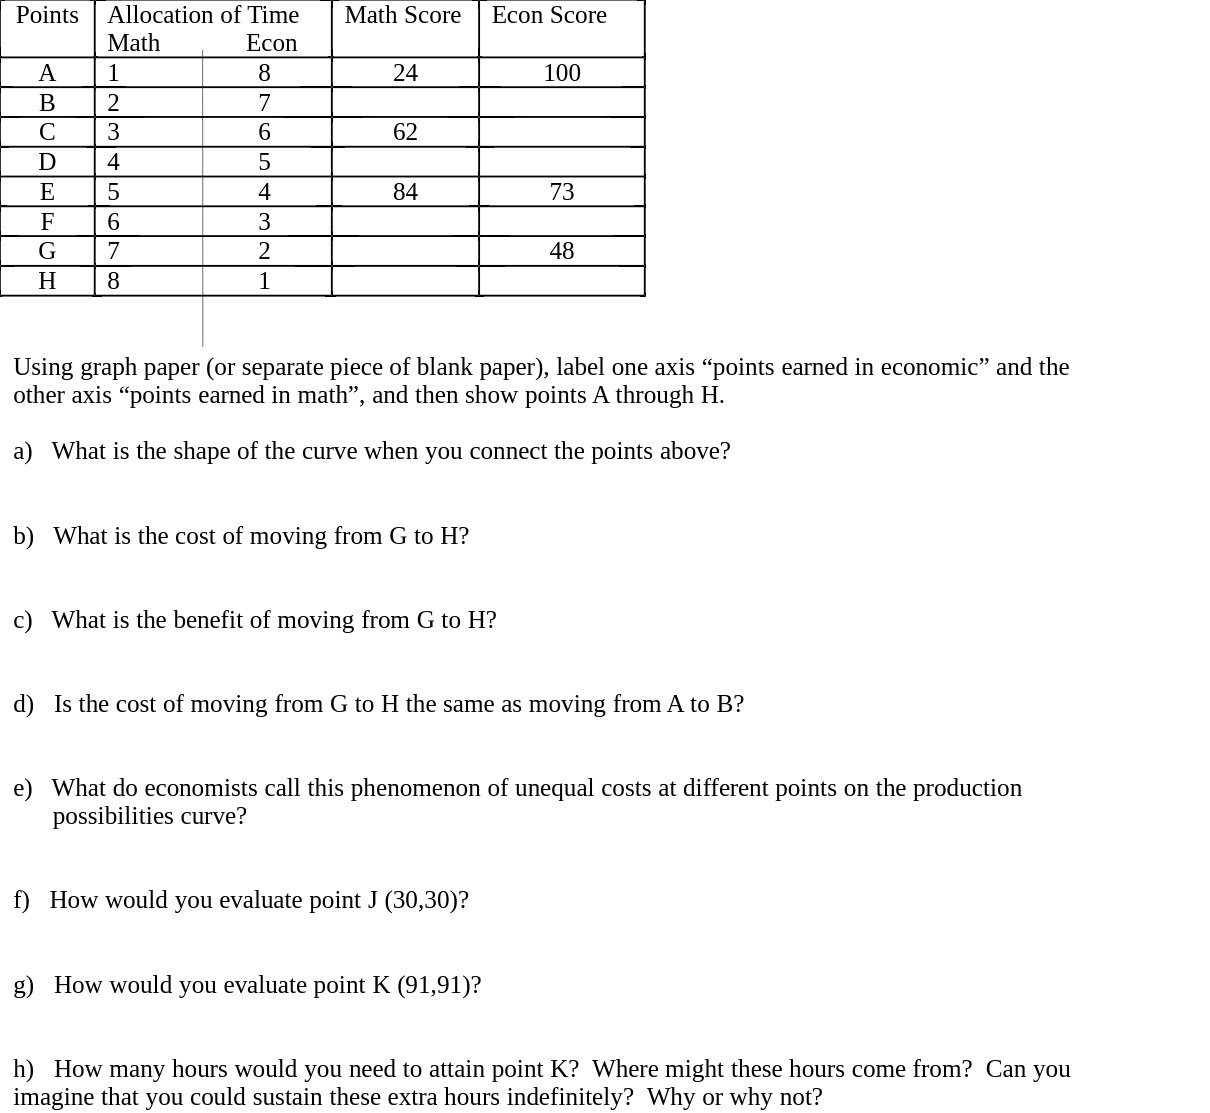
Points Allocation of Time Math Score Econ Score Math Econ A 1 8 24 100 B 2 7 C 6 62 D 4 5 E 5 4 84 73 F 6 3 G 7 2 48 H 8 1 Using graph paper (or separate piece of blank paper), label one axis "points earned in economic" and the other axis "points earned in math", and then show points A through H. a) What is the shape of the curve when you connect the points above? b) What is the cost of moving from G to H? c) What is the benefit of moving from G to H? d) Is the cost of moving from G to H the same as moving from A to B? e) What do economists call this phenomenon of unequal costs at different points on the production possibilities curve? f) How would you evaluate point J (30,30)? g) How would you evaluate point K (91,91)? h) How many hours would you need to attain point K? Where might these hours come from? Can you imagine that you could sustain these extra hours indefinitely? Why or why not
Step by Step Solution
There are 3 Steps involved in it

Get step-by-step solutions from verified subject matter experts