

Question: point(s) possible Identify the class width, class midpoints, and class boundaries for the given frequency distribution. White blood cell Frequency count of males 4.0-6.9 CC
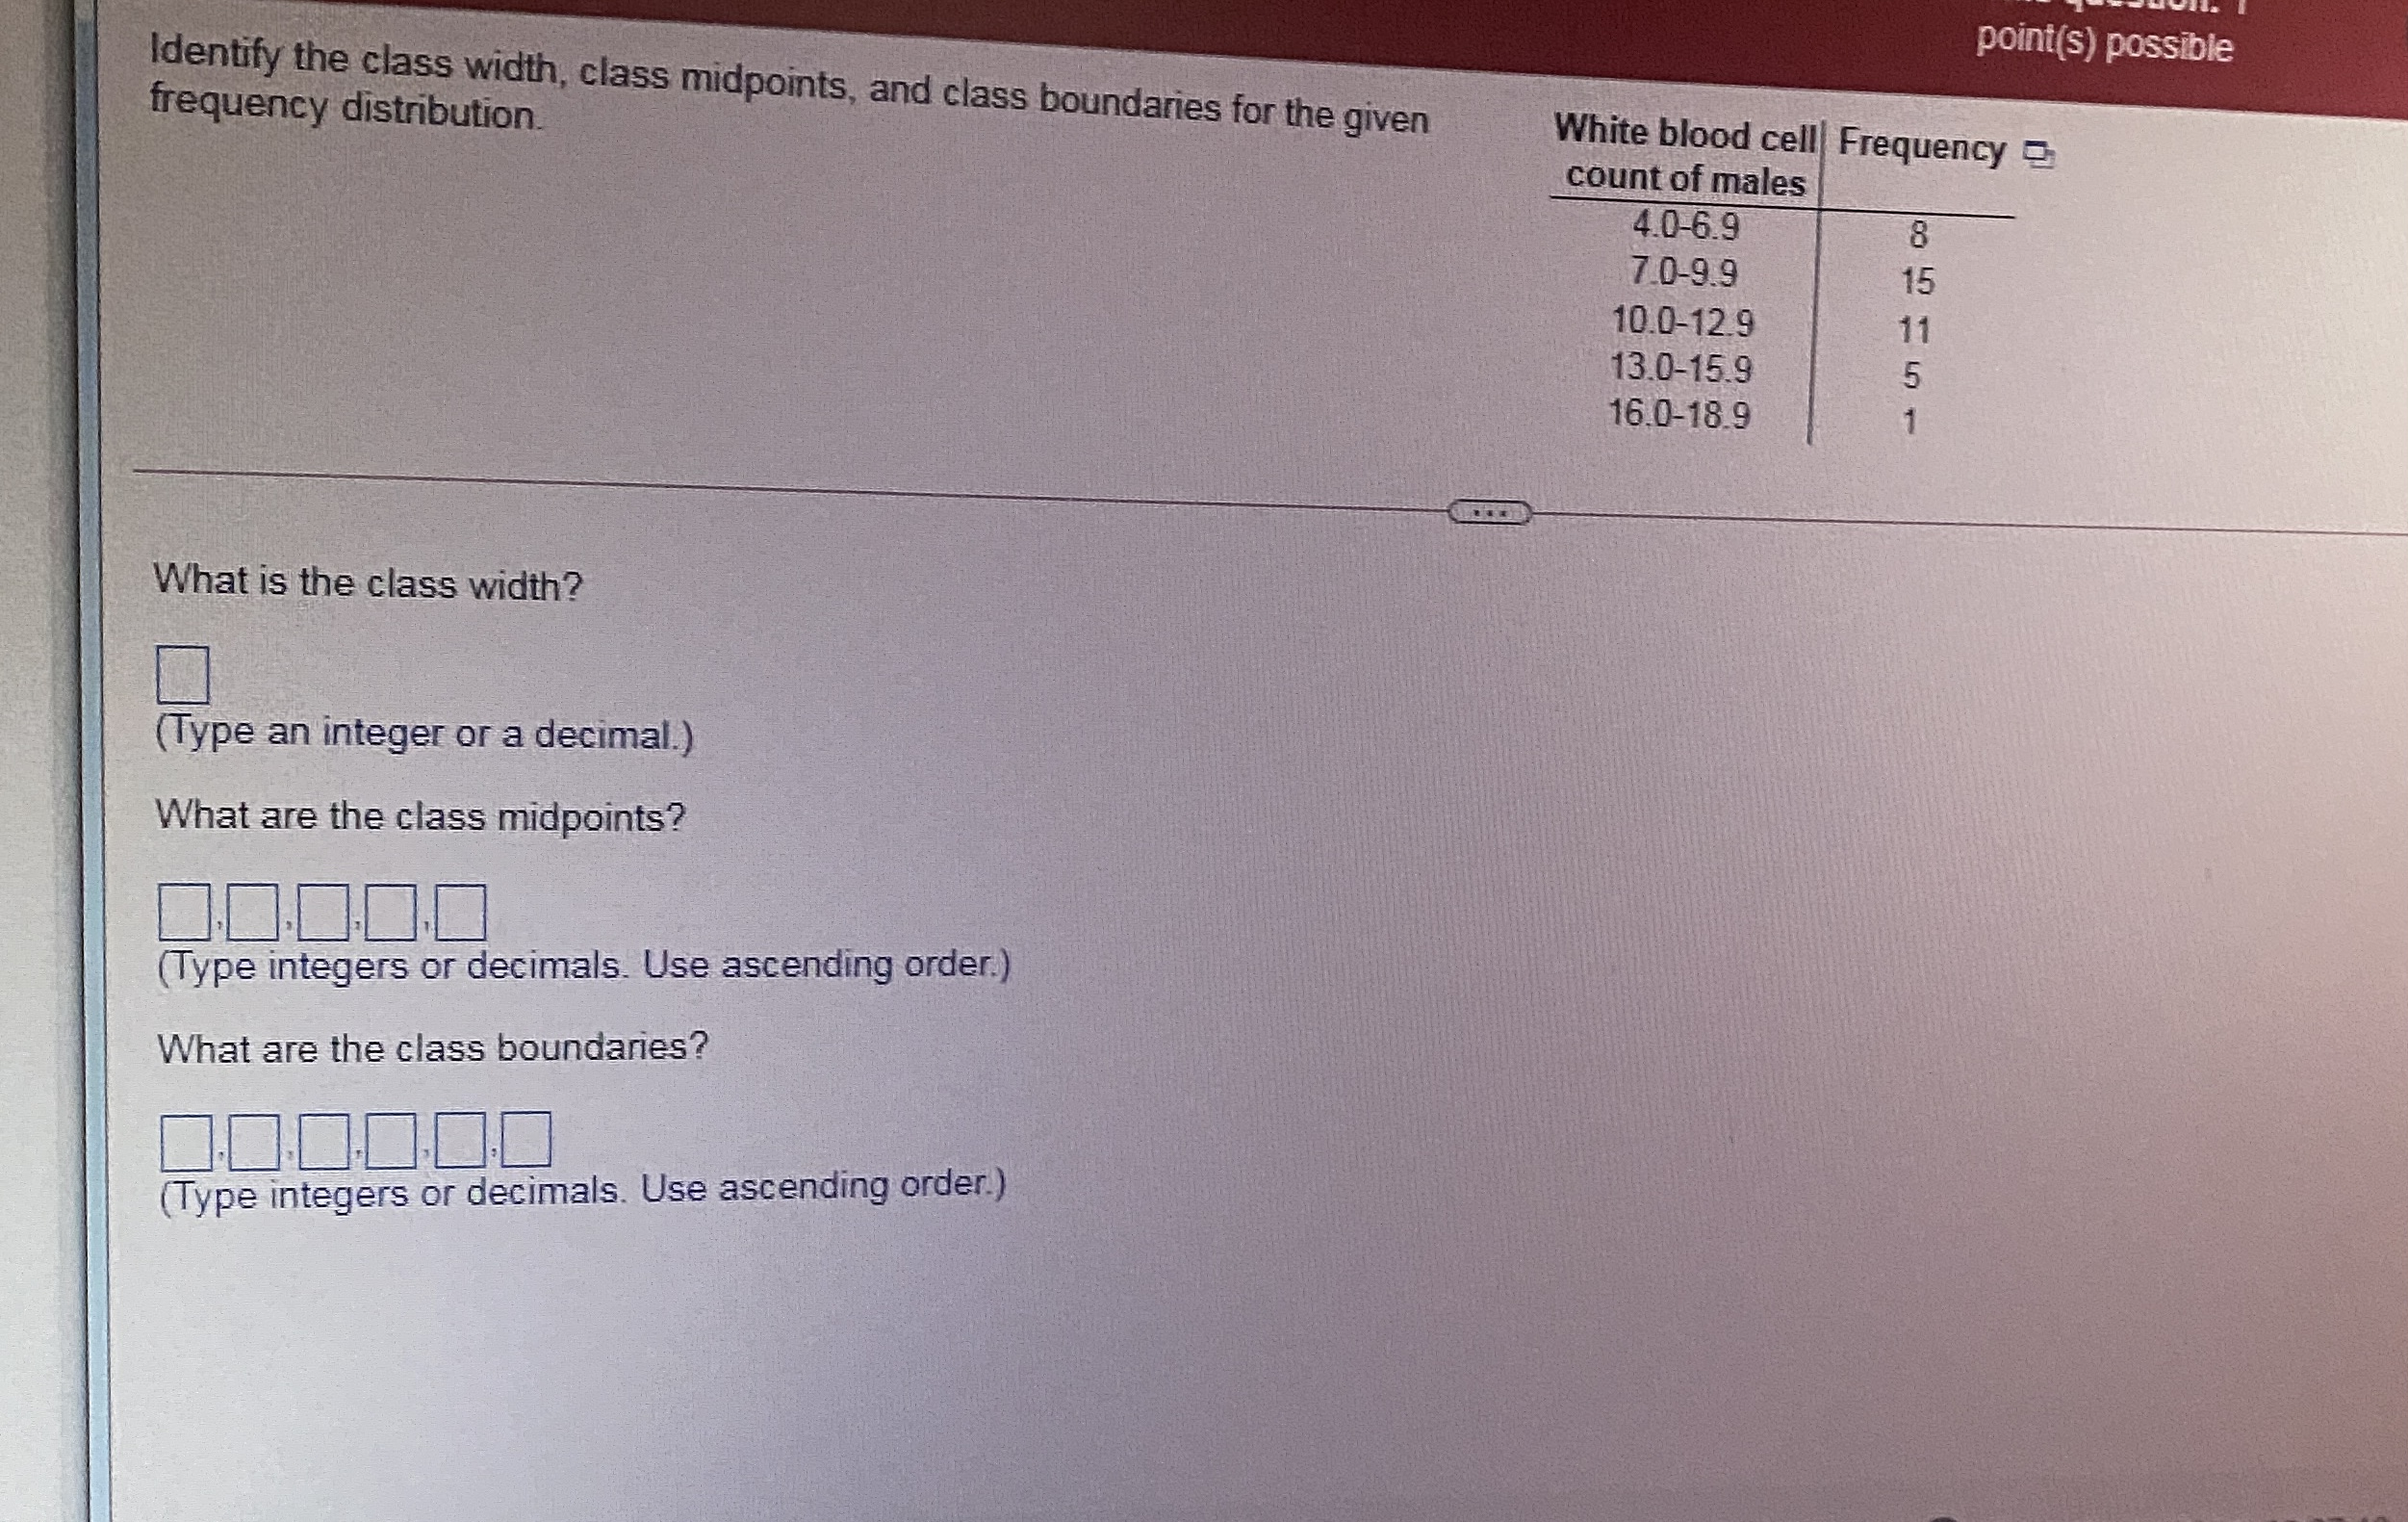
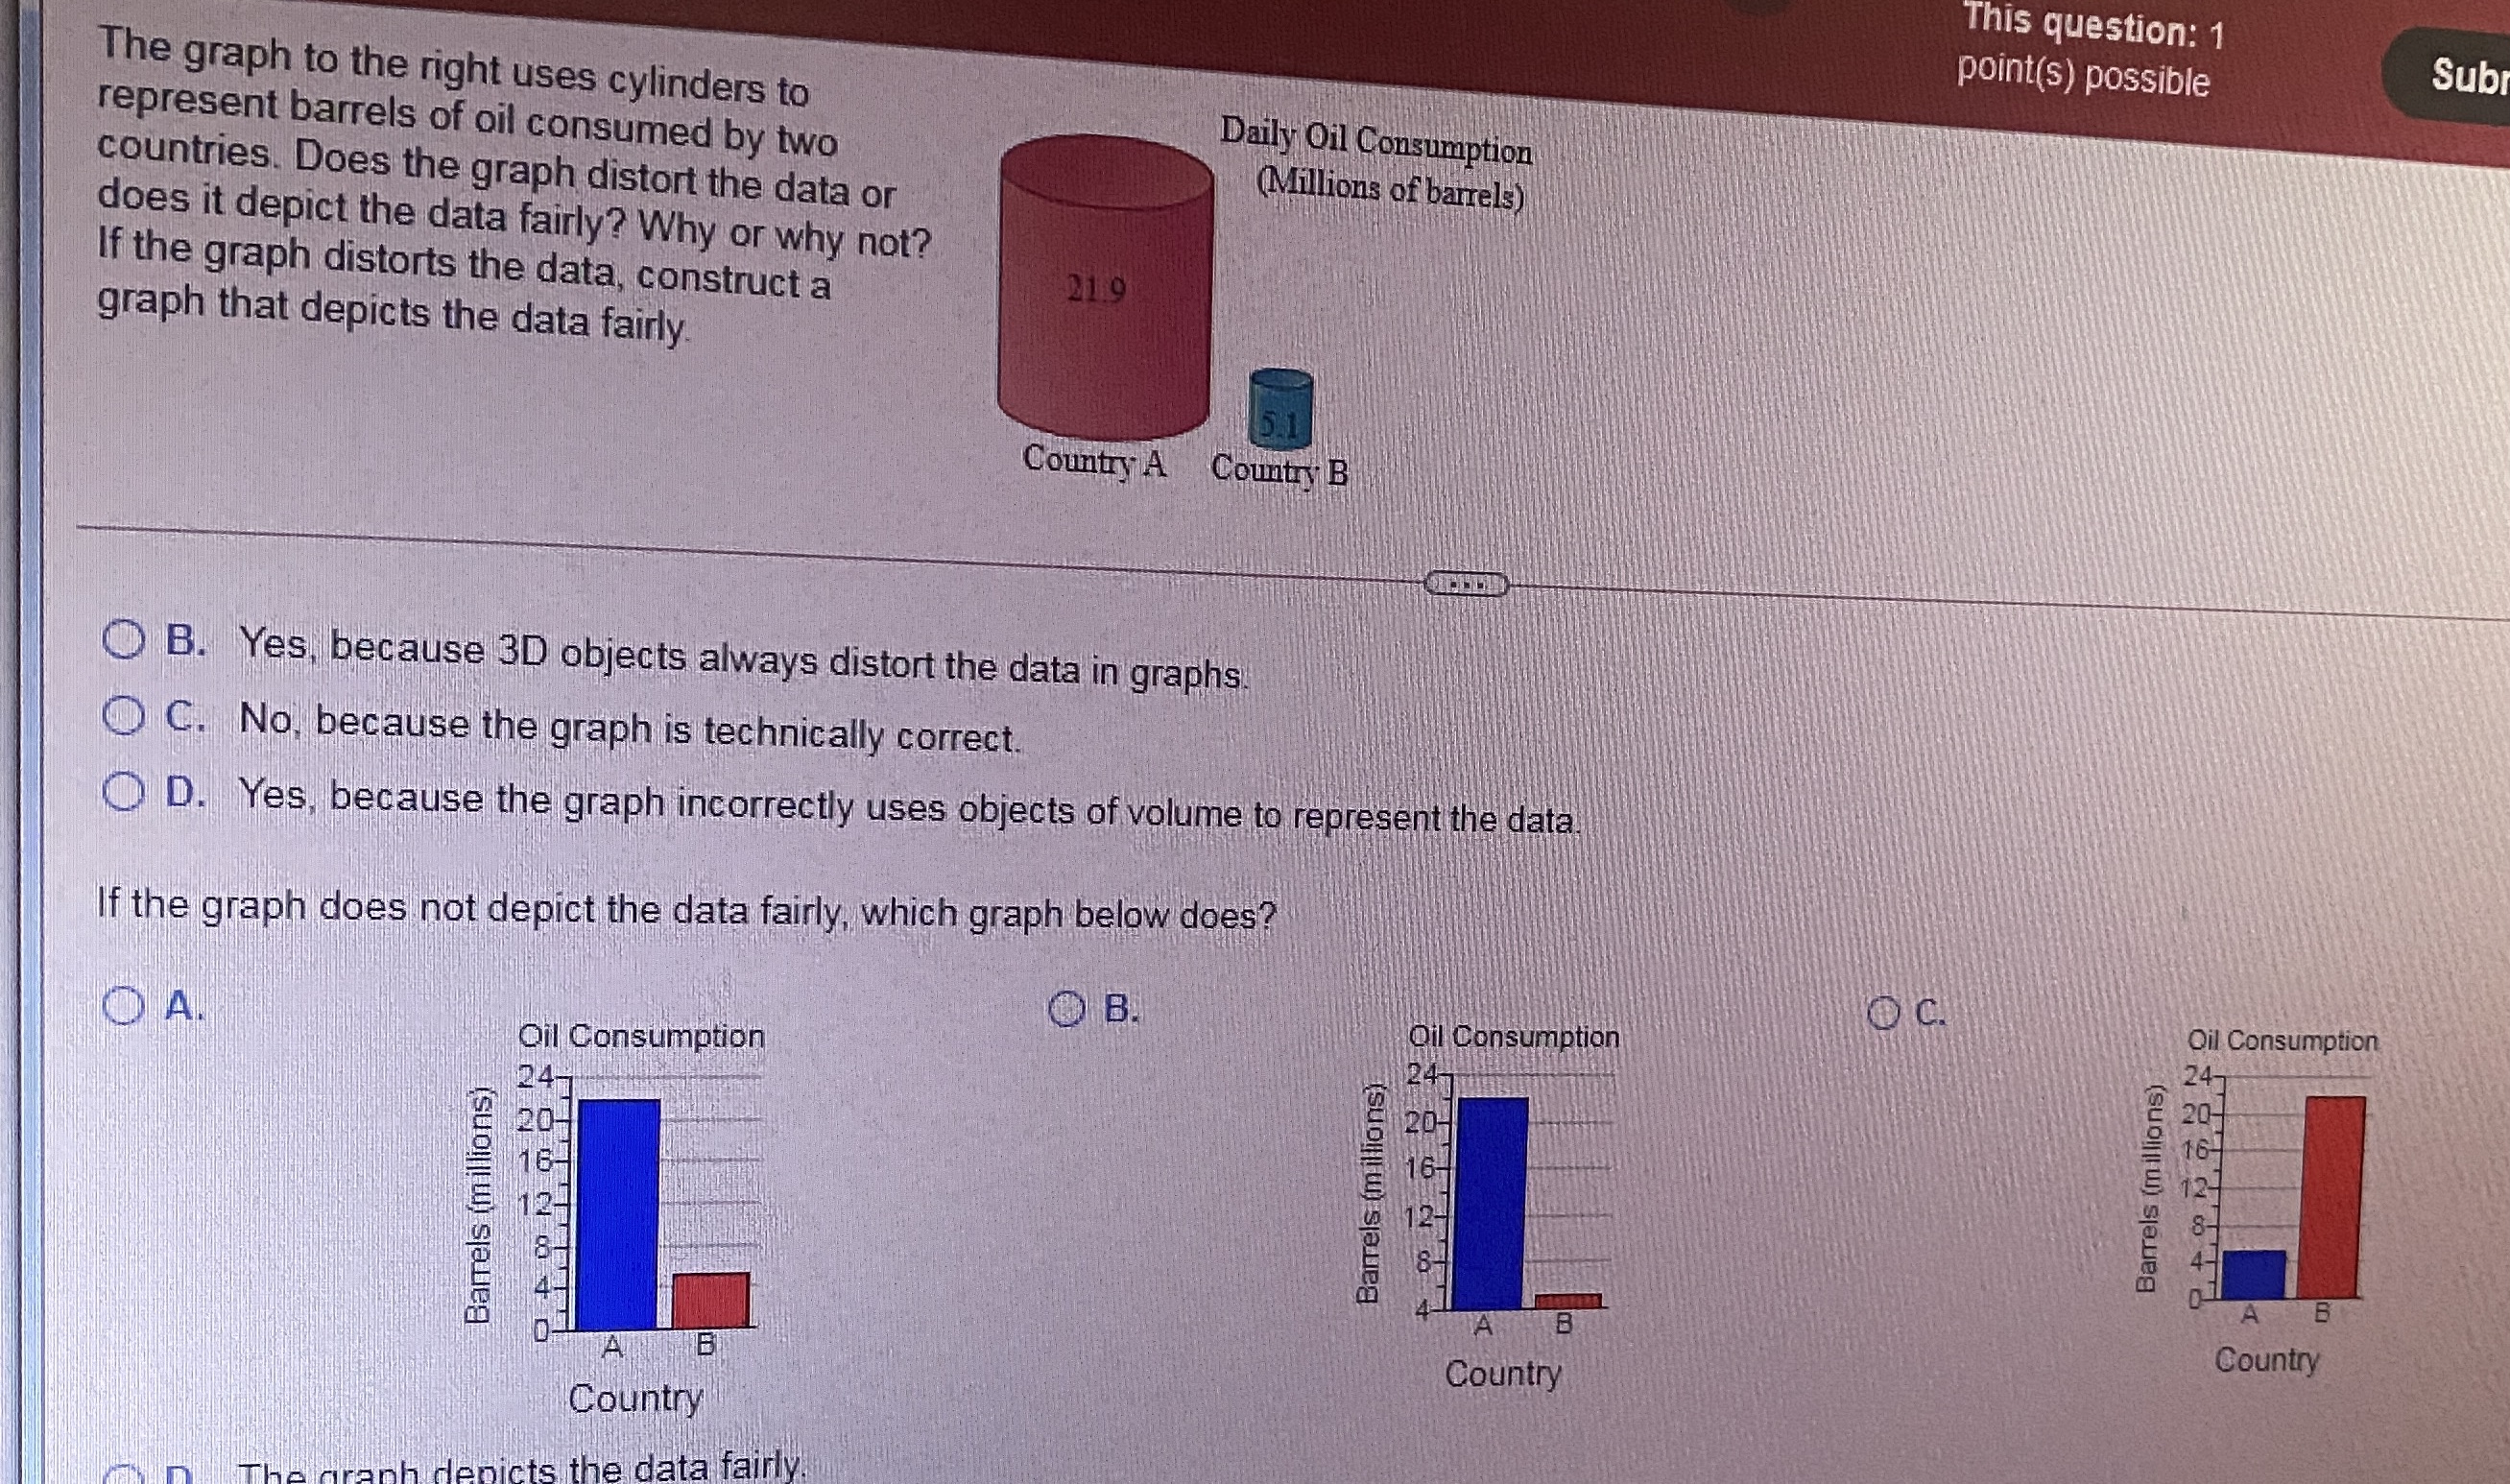
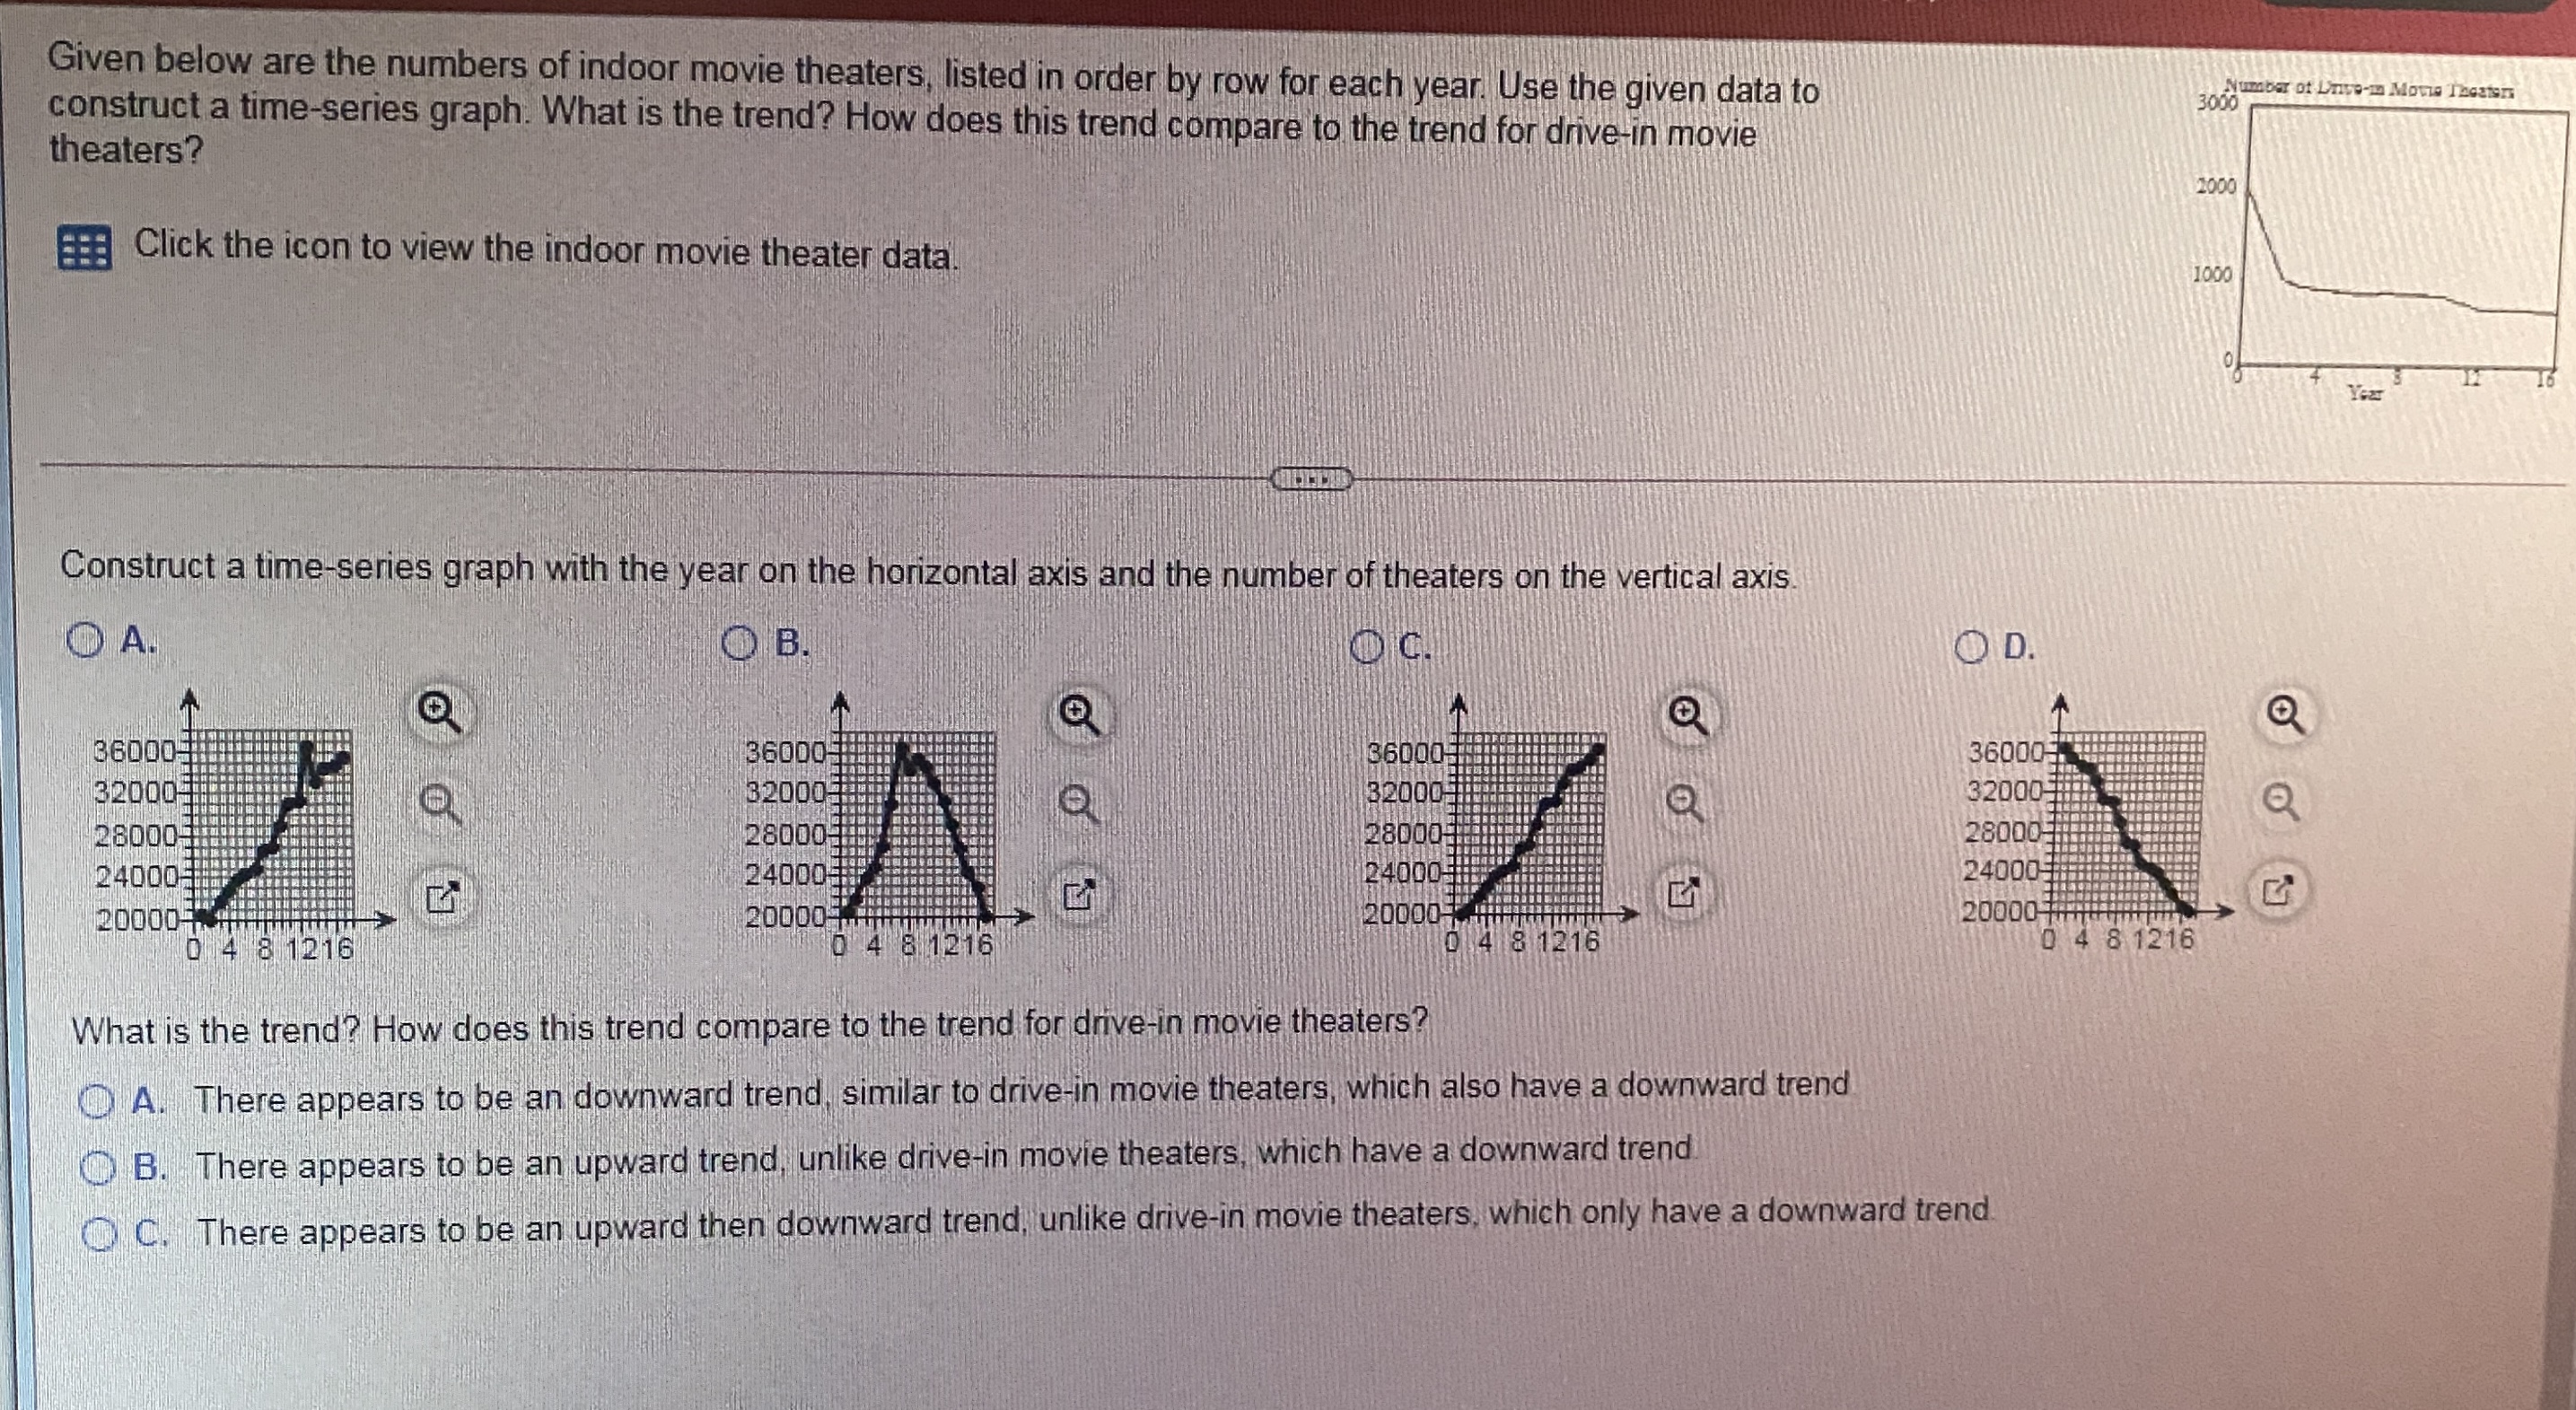
point(s) possible Identify the class width, class midpoints, and class boundaries for the given frequency distribution. White blood cell Frequency count of males 4.0-6.9 CC 7.0-9.9 15 10.0-12.9 11 13.0-15.9 16.0-18.9 What is the class width? (Type an integer or a decimal.) What are the class midpoints? 0.0.0.0.0 (Type integers or decimals. Use ascending order.) What are the class boundaries? .0.0.0.00 (Type integers or decimals. Use ascending order.)This question: 1 point(s) possible Sub The graph to the right uses cylinders to represent barrels of oil consumed by two Daily Oil Consumption countries. Does the graph distort the data or (Millions of barrels) does it depict the data fairly? Why or why not? If the graph distorts the data, construct a 21 9 graph that depicts the data fairly 51 Country A Country B OB. Yes, because 3D objects always distort the data in graphs O C. No, because the graph is technically correct. D. Yes, because the graph incorrectly uses objects of volume to represent the data If the graph does not depict the data fairly, which graph below does? OA. O B. Oil Consumption Oil Consumption Oil Consumption 247 247 WILL 247 20- 20- Barrels (millions) Barrels (millions Barrels (millions) A B A B Country A B Country Country depicts the data fairly.Given below are the numbers of indoor movie theaters, listed in order by row for each year. Use the given data to construct a time-series graph. What is the trend? How does this trend compare to the trend for drive-in movie 3000 Number of Live-in Movie Theaters theaters? 2000 Click the icon to view the indoor movie theater data. 1000 Construct a time-series graph with the year on the horizontal axis and the number of theaters on the vertical axis. OA. O B. OC. OD. O 36000 36000 36000 36000 32000% 320005 32000- 32000 28000- 28000 28000 28000 24000- 240004 24000 24000 20000 20000 7 1 HIM 20000 20000 TH 0 4 8 1216 10 4 8 1216 D 4 8 1216 D 4 8 1216 What is the trend? How does this trend compare to the trend for drive-in movie theaters? A. There appears to be an downward trend, similar to drive-in movie theaters, which also have a downward trend B. There appears to be an upward trend, unlike drive-in movie theaters, which have a downward trend C. There appears to be an upward then downward trend, unlike drive-in movie theaters, which only have a downward trend
Step by Step Solution
There are 3 Steps involved in it

Get step-by-step solutions from verified subject matter experts