

Question: point(s) possible The graph shows demand for loanable funds curve Suppose the real interest rate falls. 8- Real interest rate (percent per year) Draw either

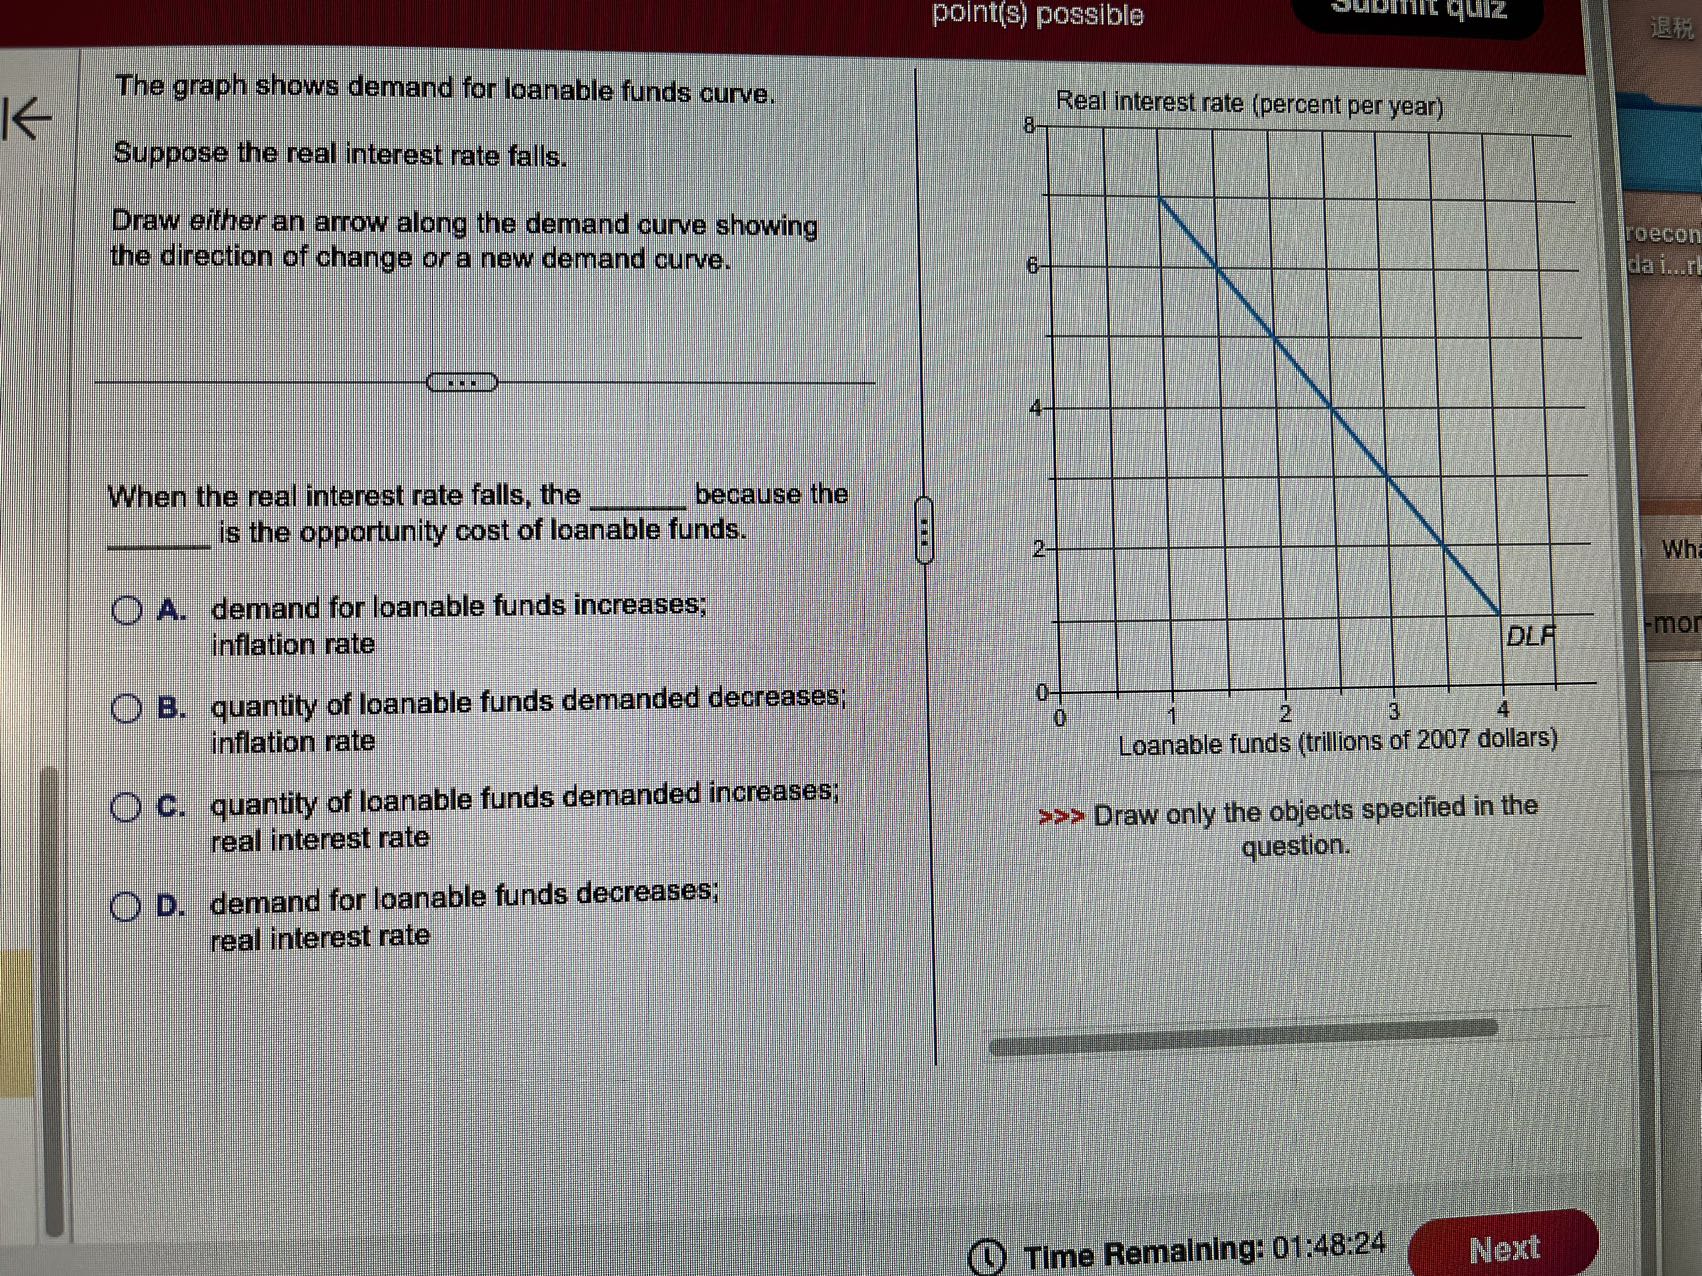
point(s) possible The graph shows demand for loanable funds curve Suppose the real interest rate falls. 8- Real interest rate (percent per year) Draw either an arrow along the demand curve showing the direction of change or a new demand curve. roeco da i...r When the real interest rate falls, the because the is the opportunity cost of loanable funds. 2 - Wh O A. demand for loanable funds increases; inflation rate DLA -mo O B. quantity of loanable funds demanded decreases; inflation rate Loanable funds (trillions of 2007 dollars) O C. quantity of loanable funds demanded increases; real interest rate 2>> Draw only the objects specified in the question. O D. demand for loanable funds decreases; real interest rate Time Remaining: 01:48:24 Next
Step by Step Solution
There are 3 Steps involved in it

Get step-by-step solutions from verified subject matter experts